How to Monitor Slow MySQL Queries


Enable the Slow Query Log
The slow query log is MySQL's built-in mechanism for recording every query that takes longer than a threshold you define. It is off by default on most Ubuntu installations. Enable it in /etc/mysql/mysql.conf.d/mysqld.cnf (Ubuntu 24.04 with MySQL 8.x) by adding the following lines to the [mysqld] section:
Setting long_query_time = 1 captures every query that takes more than one second. Start here; you can lower it to 0.5 or 0.1 seconds once you have dealt with the obvious outliers. The log_queries_not_using_indexes flag is equally important — it catches full table scans even when they complete quickly, which is often where performance problems are hiding before traffic scales.
Confirm the log directory exists and MySQL can write to it: sudo mkdir -p /var/log/mysql && sudo chown mysql:mysql /var/log/mysql. Without this, MySQL will silently skip logging and SHOW VARIABLES LIKE 'slow_query_log' will show OFF even after the config change.
You can also enable it at runtime without touching the config file, which is useful for a quick diagnostic session on a production server where you do not want to risk a reload:
Read and Parse the Log
The raw slow query log is verbose and hard to scan. Two tools — mysqldumpslow (bundled with MySQL) and pt-query-digest from Percona Toolkit — aggregate repeated queries so you can see which patterns are causing the most damage.
mysqldumpslow is sufficient for most situations — it strips literal values from queries and groups them by pattern, so twenty different SELECT * FROM wp_posts WHERE ID = N calls appear as a single entry with a combined time. pt-query-digest adds 95th-percentile timing, lock-wait time, and rows-examined metrics that are invaluable when a query runs fast on average but spikes badly under load.
Focus on the queries ranked highest by total time first, not just the single slowest query. A query that takes 5 seconds but runs once a day is far less urgent than one that takes 200 ms but runs 500 times per minute — that second query costs 100 seconds of database time per minute.
Diagnose with EXPLAIN
Once you have a candidate query from the slow log, prefix it with EXPLAIN or EXPLAIN ANALYZE to see exactly how MySQL executes it. This is the single most useful diagnostic tool MySQL provides — it shows which indexes are used, how many rows are examined, and what join strategy is chosen.
The most important columns in EXPLAIN output are type, possible_keys, key, rows, and Extra. Here is what to look for:
- type = ALL — a full table scan. Every row is read. Fix this with an index.
- type = index — a full index scan. Better than ALL but still reads every index entry.
- type = ref or range — MySQL is using an index selectively. This is what you want.
- rows — estimated rows examined. A query returning 10 rows that examines 500,000 has a selectivity problem.
- Extra = Using filesort — MySQL cannot use an index to satisfy ORDER BY and is sorting in memory or on disk.
- Extra = Using temporary — MySQL created a temporary table, often because of GROUP BY or DISTINCT on non-indexed columns.
Use EXPLAIN FORMAT=JSON for a structured breakdown that includes cost estimates and loop details, especially helpful when a query has multiple joins. The JSON format also shows cost_info per table, which helps you decide which join to optimize first.
Fix Missing Indexes
After EXPLAIN shows a full table scan or a high rows-examined count, adding the right index is usually the fix. The column or columns in your WHERE clause, JOIN ON condition, and ORDER BY clause are all candidates for indexing. Composite indexes need to be ordered carefully — put the most selective column first, and if the query includes both a range condition and an ORDER BY, the ORDER BY column generally comes last in the index.
On a live production server, use ALTER TABLE ... ADD INDEX with caution on large tables — MySQL 8.x adds indexes online by default (it does not lock reads or writes), but it does consume I/O. Run it during a low-traffic window on tables with tens of millions of rows, or use pt-online-schema-change from Percona Toolkit if you need zero-disruption operation.
Do not index every column you filter on. Indexes consume disk space and slow down INSERT, UPDATE, and DELETE operations because MySQL must maintain each index on every write. Remove indexes that are never used: query performance_schema.table_io_waits_summary_by_index_usage to find indexes with a zero count_read — those are candidates for removal.
Performance Schema: Real-Time Query Statistics
The slow query log is a file written after the fact. The Performance Schema is a live in-memory database that accumulates query statistics while MySQL is running. It is enabled by default on MySQL 8.x. The most useful table for slow query hunting is events_statements_summary_by_digest, which aggregates by query fingerprint just like pt-query-digest does — but without needing to touch any log files.
Timers in Performance Schema are stored in picoseconds, which is why dividing by 1e12 converts them to seconds. The SUM_ROWS_EXAMINED column tells you how much work MySQL is doing for each query type. A high ratio of rows examined to rows returned points directly at a missing index.
The sys schema, also enabled by default in MySQL 8.x, wraps Performance Schema into human-readable views. Two views worth checking regularly:
To reset accumulated statistics after you have made changes — so you can measure the effect of a new index cleanly — run TRUNCATE TABLE performance_schema.events_statements_summary_by_digest;. This clears the digest table without affecting running queries or any other MySQL state.
CloudStick DB Monitoring
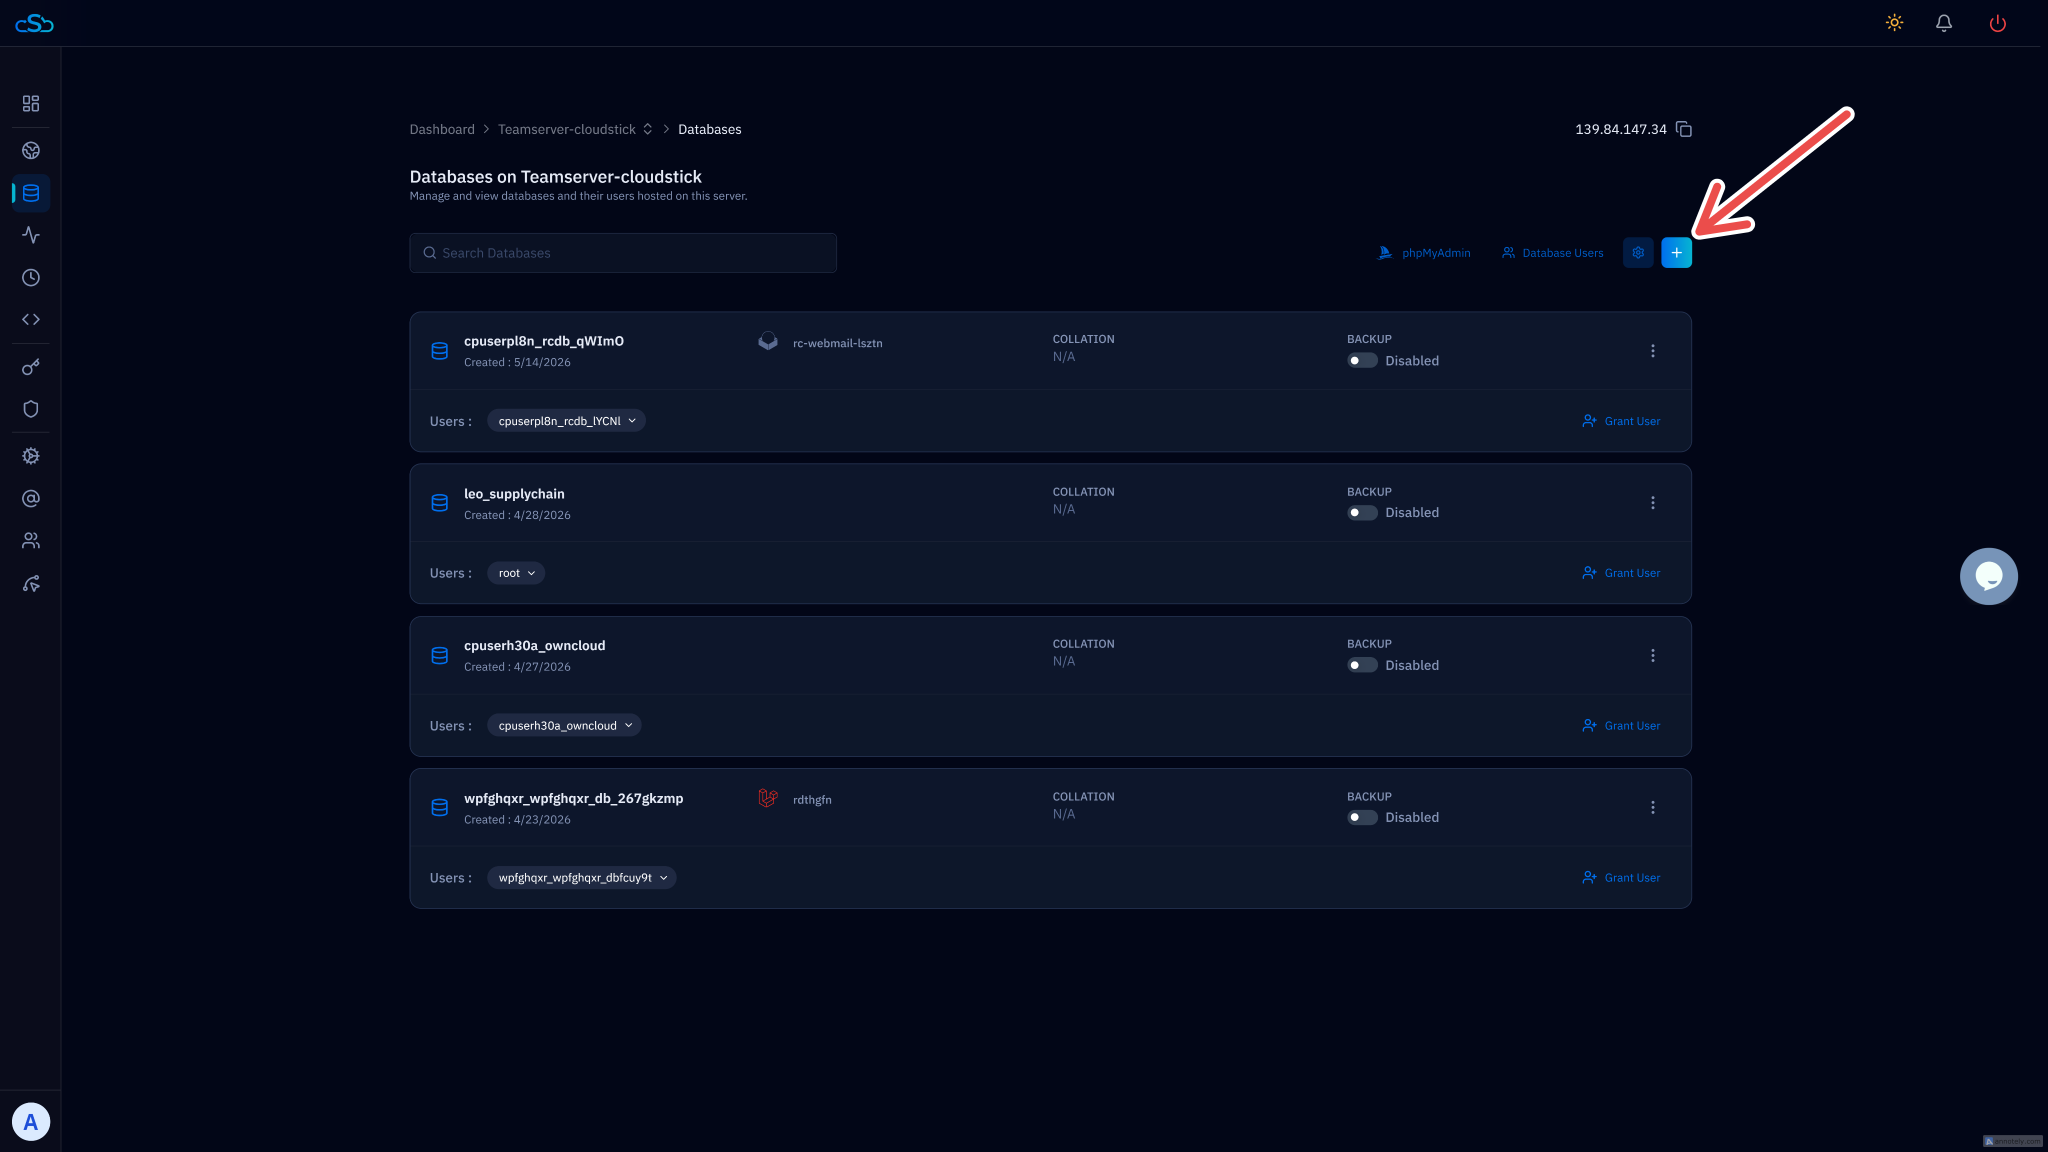
The workflow above — enable the slow log, run mysqldumpslow, run EXPLAIN, add indexes — is the correct mental model regardless of tooling. But if you manage multiple servers and want visibility without SSHing into each one, CloudStick's database panel surfaces slow query counts, active processes, and InnoDB buffer pool hit rates directly in the dashboard so you can spot a degraded database at a glance without pulling up the MySQL CLI.
A few operational habits that compound over time and keep slow queries from accumulating in the first place:
- Keep long_query_time on permanently. The overhead of writing to the slow log is negligible compared to the diagnostic value. Set it to 1 second on production as a baseline and leave it enabled — you want to know immediately when a deployment or schema change creates a regression.
- Check mysqldumpslow output weekly. New slow queries often appear after application deployments, data growth, or traffic pattern changes. A weekly review takes two minutes and catches issues before users notice them.
- Monitor InnoDB buffer pool efficiency. Run
SHOW STATUS LIKE 'Innodb_buffer_pool_read%'and check the ratio ofInnodb_buffer_pool_reads(disk reads) toInnodb_buffer_pool_read_requests(total requests). A hit ratio below 99% means MySQL is going to disk frequently, and you should consider increasinginnodb_buffer_pool_size. - Test queries in staging before deployment. Run EXPLAIN on any new or changed query as part of your review process. A missing index in a code change is far easier to catch before it reaches production than after it starts appearing in the slow log at 2 AM.