How to Reduce WordPress TTFB (Time to First Byte)


What Is TTFB?
TTFB — Time to First Byte — is the elapsed time between a browser sending an HTTP request and receiving the first byte of the server's response. It is the earliest performance signal in the browser waterfall: every millisecond added here delays every subsequent resource — CSS, JS, images — by the same amount. Google's Core Web Vitals guidance flags TTFB above 800 ms as poor; anything above 200 ms on an uncached request warrants investigation.
For WordPress, high TTFB almost always has one of four root causes: PHP processing time, database query overhead, no page cache (so PHP runs for every visitor), or an under-resourced PHP-FPM pool that queues requests. The good news is that all four are fixable at the server level — no plugin can substitute for getting the stack right.
This guide works through each layer systematically: measure first, then fix caching, PHP-FPM, database, and object cache in order. Fixing them out of order wastes time — you cannot accurately benchmark PHP tuning until page caching is in place, because a cache hit never touches PHP at all.
Measure Your Baseline
Before touching any configuration, establish a reproducible baseline. Two tools give you ground truth: curl for raw server timing, and Chrome DevTools Network panel for the full waterfall. Always measure with the cache bypassed — add a query string or a Cache-Control: no-cache header — so you are measuring PHP execution, not a cached hit.
Record the median TTFB. You want to track three numbers as you work through this guide: uncached TTFB (PHP must run), cached TTFB (Nginx serves a cached page), and database query time (visible in Query Monitor). Each optimisation step should move at least one of these numbers measurably.
These instructions assume a CloudStick-managed server running Ubuntu 22.04 with Nginx (nginx-cs) as the frontend, Apache (apache2-cs) on port 81 as the backend, and PHP-FPM managed through CloudStick's EasyPHP packages. Verify your PHP version is 8.1 or above before proceeding — anything older will bottleneck you before you reach the OS layer.
Server-Side Caching
The single biggest TTFB reduction available to any WordPress site is full-page caching at the Nginx layer. When Nginx FastCGI cache is active, a cache hit bypasses PHP-FPM and MariaDB entirely — the response comes straight from disk in 2–10 ms regardless of how complex the page is. The difference between a 600 ms uncached TTFB and a 6 ms cached one is not an exaggeration; it is routine.
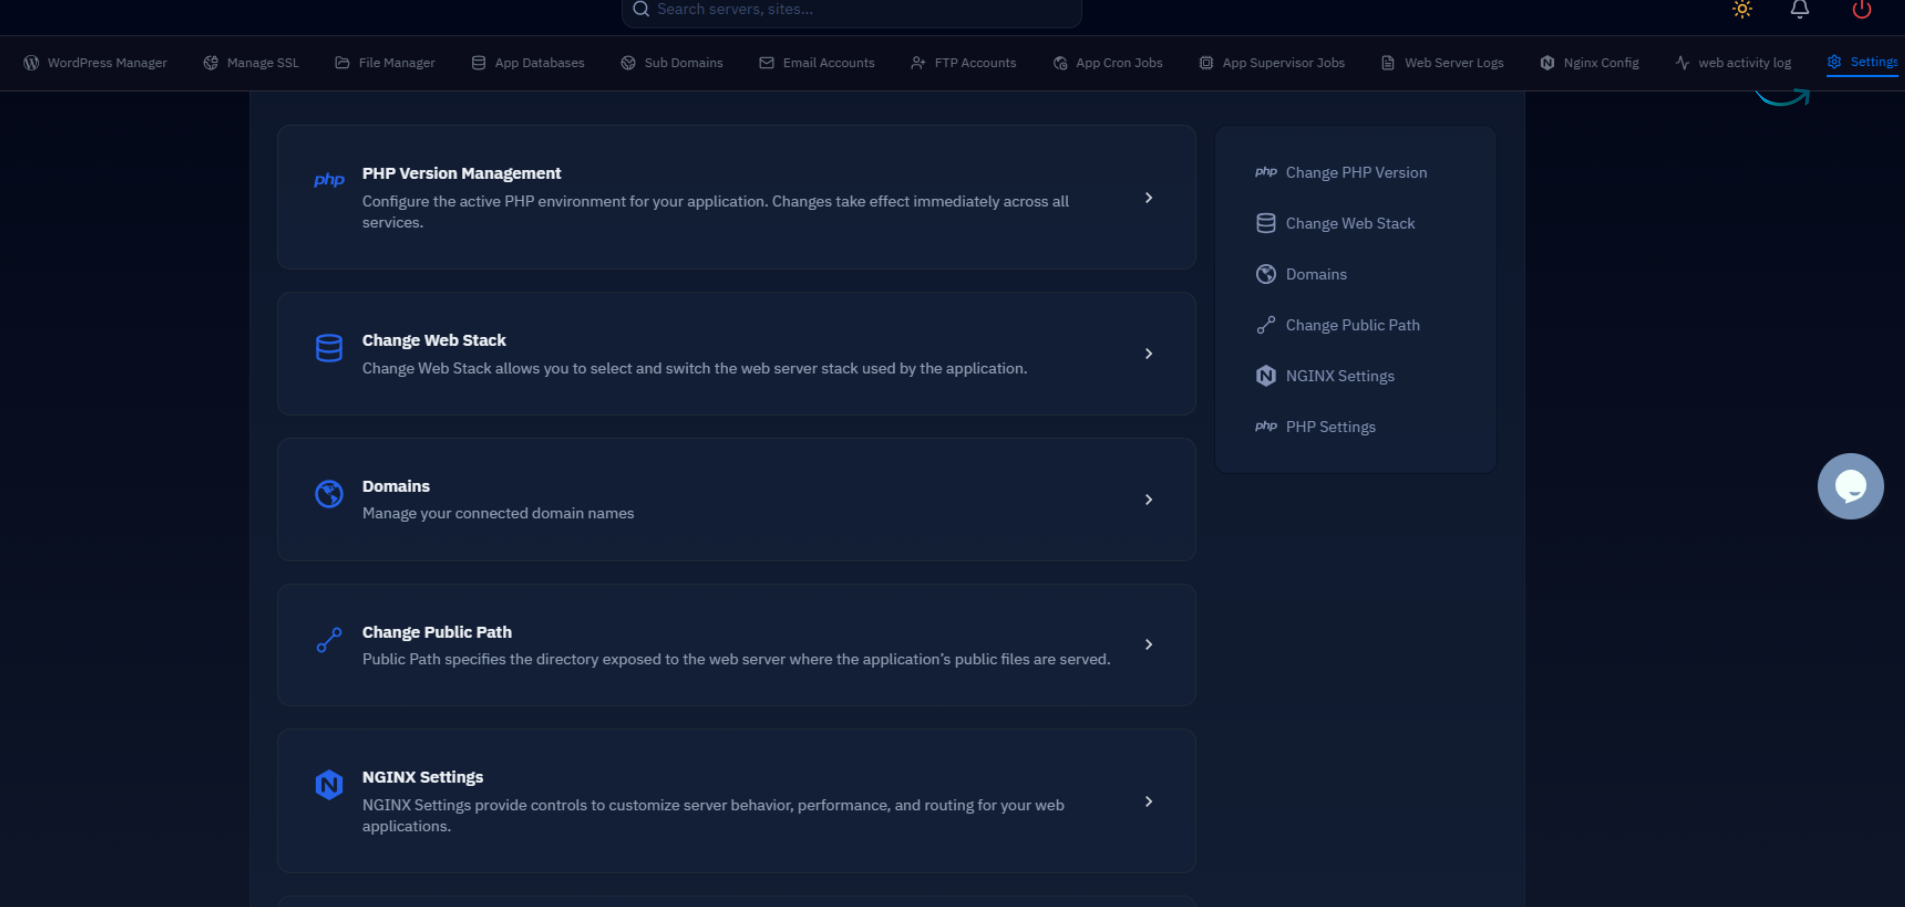
CloudStick's WordPress manager enables Nginx FastCGI caching with a single toggle from the site dashboard — no manual Nginx config editing required. Once enabled, you should see cached TTFB drop below 20 ms for most pages. The panel also lets you purge the cache on-demand or configure automatic purge on post update.
For sites that require manual Nginx configuration, the FastCGI cache zone belongs in your /etc/nginx-cs/nginx.conf http block:
The X-FastCGI-Cache header will return HIT, MISS, or BYPASS — confirming which code path each request took. During testing, check this header on every request you benchmark.
PHP-FPM Tuning
Even with caching in place, uncached requests — admin-bar users, WooCommerce checkout, REST API calls — still hit PHP. PHP-FPM pool misconfiguration is the most common reason these uncached requests queue: if the pool runs out of workers, every new request waits in a backlog, and TTFB climbs with traffic.
CloudStick installs PHP-FPM pools under /CloudStick/Packages/php/<version>/etc/php-fpm.d/. Each site gets its own pool file named after the site user. Open the relevant pool file and tune the following parameters based on your server's available RAM:
After editing the pool file, reload PHP-FPM without interrupting active connections. Replace 8.3 with your site's active PHP version:
OPcache is equally important. WordPress loads hundreds of PHP files on every uncached request; OPcache stores compiled bytecode in shared memory, eliminating the parse-and-compile step on subsequent requests. Verify it is active and sized correctly:
With OPcache warm and pool workers sized correctly, uncached PHP response times for a mid-complexity WordPress page typically drop from 400–800 ms to 80–180 ms on a 2 vCPU / 2 GB server.
Database & Query Optimization
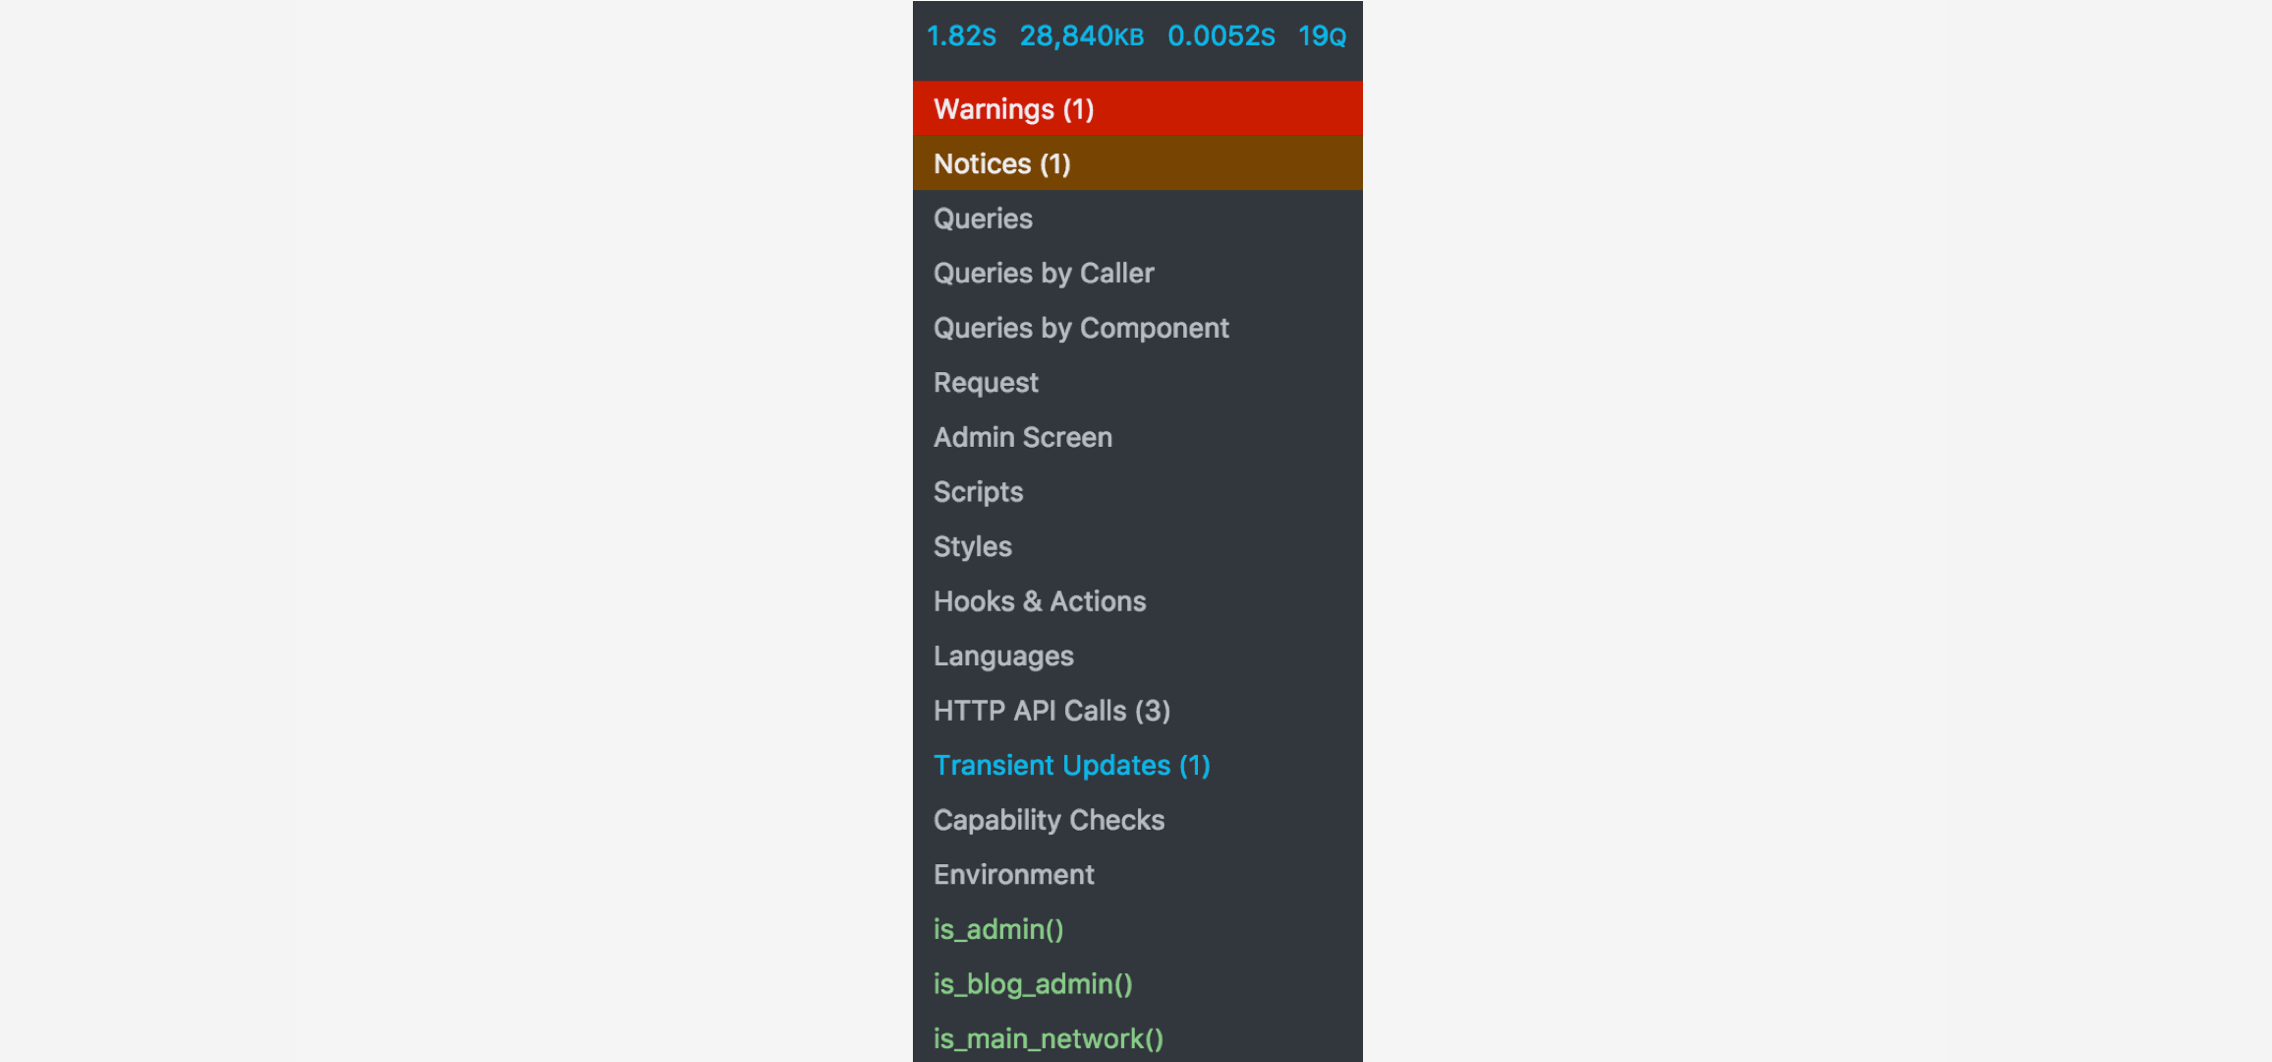
Database time is a frequent hidden contributor to TTFB — and one that plugin authors rarely address. Install the Query Monitor plugin on staging to get a breakdown of every query fired on each page load, including query time, caller, and duplicates. A single unindexed meta query scanning tens of thousands of rows can add 200–400 ms to every page load.
On the MariaDB 10.6 side, the InnoDB buffer pool is the most impactful knob. It caches table data and index pages in RAM; when the buffer pool is large enough to hold your working set, reads become memory operations rather than disk I/O. Set it to 50–70% of available RAM on a dedicated database server, or 25–40% on a shared web + DB server:
Enable the slow query log temporarily, run a representative sample of page loads, then review the log with mysqldumpslow -s t /var/log/mysql/slow.log | head -20. The top offenders are usually postmeta or usermeta range scans that WordPress plugins generate without appropriate indexes.
A common pattern: WooCommerce or a membership plugin fires 40–60 uncached postmeta queries on every page load. The fix is rarely rewriting the plugin — it is enabling the Redis object cache so those queries execute once per cache lifetime, not once per request.
Also schedule a weekly OPTIMIZE TABLE run on the wp_options table. Sites with large autoloaded option sets — some grow to 3–5 MB from poorly coded plugins — add 50–100 ms to every page load because WordPress fetches the entire autoloaded set on init.
Redis Object Cache
Redis object caching sits between PHP and MariaDB, storing the results of expensive database queries in memory. Unlike full-page caching — which skips PHP entirely for anonymous visitors — object caching accelerates all requests, including logged-in users, WooCommerce sessions, and REST API calls. For high-traffic sites or those with many logged-in users, object cache is often the difference between a 300 ms and a 60 ms uncached TTFB.
Redis is available as a standard system service on CloudStick servers. Enable and configure it via the Service Management section of your server dashboard, then verify it is listening before connecting WordPress:
Install the Redis PHP extension using EasyPHP in your CloudStick dashboard (look for the phpredis extension under the PHP Extensions tab for your site's PHP version). Then install and activate the Redis Object Cache plugin in WordPress and connect it to the local Unix socket for lowest latency:
Enable the Unix socket in Redis by setting unixsocket /var/run/redis/redis-server.sock and unixsocketperm 770 in /etc/redis/redis.conf, then add the site's PHP-FPM user to the redis group.
Once connected, verify the cache is warming by watching the hit ratio in the plugin's dashboard widget. A warm cache on a typical WordPress site shows 80–95% hit ratios after a few minutes of traffic, and database query counts drop from 30–60 per page to 5–10 — the remainder being writes and queries that cannot be cached.
On a WooCommerce store, the combination of full-page FastCGI cache for guest visitors and Redis object cache for authenticated users routinely brings uncached TTFB from 500–900 ms down to 80–150 ms without any changes to PHP code or plugins.
Next Steps
With caching, PHP-FPM, and Redis addressed, you have closed the largest gaps. The remaining TTFB budget — typically 20–60 ms — comes from TLS session resumption, HTTP/2 or HTTP/3 push, and CDN edge proximity. These are worth optimising, but only after the stack-level work above is complete and verified.
Run your curl baseline again, then compare against your starting numbers. For uncached requests: target under 200 ms. For cached FastCGI hits: target under 30 ms. If either number is still high after following this guide, the bottleneck is almost certainly a slow plugin on the critical path — use Query Monitor with the Timeline panel to pinpoint it.
The checklist to work through, in order:
- Enable Nginx FastCGI page cache via CloudStick's WordPress manager — measure cached TTFB.
- Size PHP-FPM pool workers based on available RAM; enable and size OPcache.
- Enable the slow query log; identify and address the top 3–5 slow queries.
- Set InnoDB buffer pool to 25–50% of server RAM; restart MariaDB.
- Enable Redis via CloudStick Service Management; install phpredis via EasyPHP; connect WordPress via Unix socket.
- Re-run your
curlbaseline and compare to your starting TTFB. - If TTFB is still above target, profile plugin load time with Query Monitor's Hooks panel.
A well-tuned CloudStick server with FastCGI caching, a properly sized PHP-FPM pool, OPcache, and Redis object cache will comfortably serve the majority of WordPress sites at under 200 ms uncached TTFB and under 20 ms cached — fast enough to score green on Core Web Vitals regardless of content complexity.