How to enable WordPress debug mode in CloudStick
Overview
When a WordPress site behaves unexpectedly — blank screens, plugin conflicts, theme errors — debug mode is the fastest way to surface the underlying error. Normally, enabling WordPress debugging requires manually editing wp-config.php over SSH or FTP. With CloudStick's WordPress Manager, you can toggle debugging on with a single click, directly from the control panel.
This guide walks you through enabling the Debugging option in WordPress Manager's General settings. Once enabled, WordPress will log errors to a debug log file, making it easier to diagnose and fix issues without guesswork.
Debug mode is intended for development and troubleshooting only. Disable it on production sites once you have identified the issue, as it can expose internal error details to visitors if display errors are on.
Step 1: Navigate to Your Server
Start from the CloudStick Dashboard, where all your connected servers are listed with real-time resource usage and uptime status.
1. Log in to CloudStick: Go to app.cloudstick.io and sign in with your credentials.
2. Locate your server: Find the server hosting your WordPress website. Click the Manage button on its card to open the server panel.
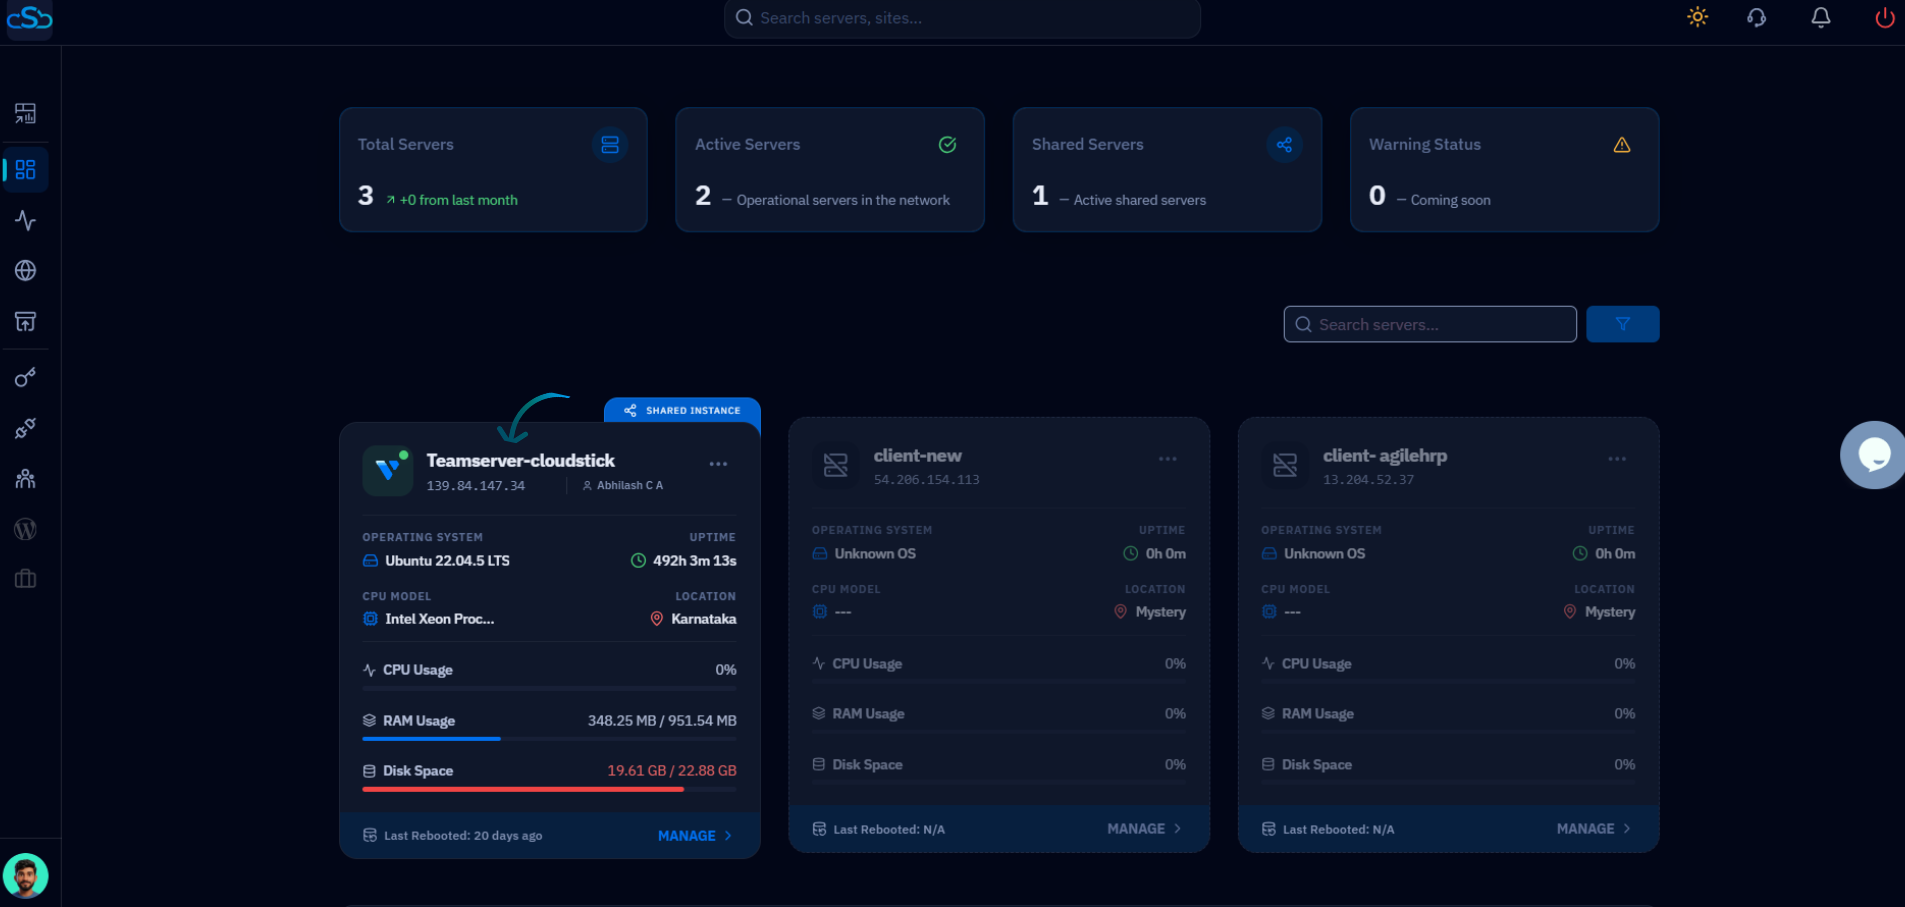
Fig. 01 — CloudStick Dashboard showing connected servers. Click Manage on the server hosting your WordPress site.
Step 2: Select Your WordPress Website
Inside the server panel, navigate to Websites to find the WordPress installation you want to debug.
1. Open Websites: In the left-hand navigation of the server panel, click the Websites icon to open the WebApp List.
2. Select your WordPress site: Locate your WordPress website in the list and click on it to open the site management view.
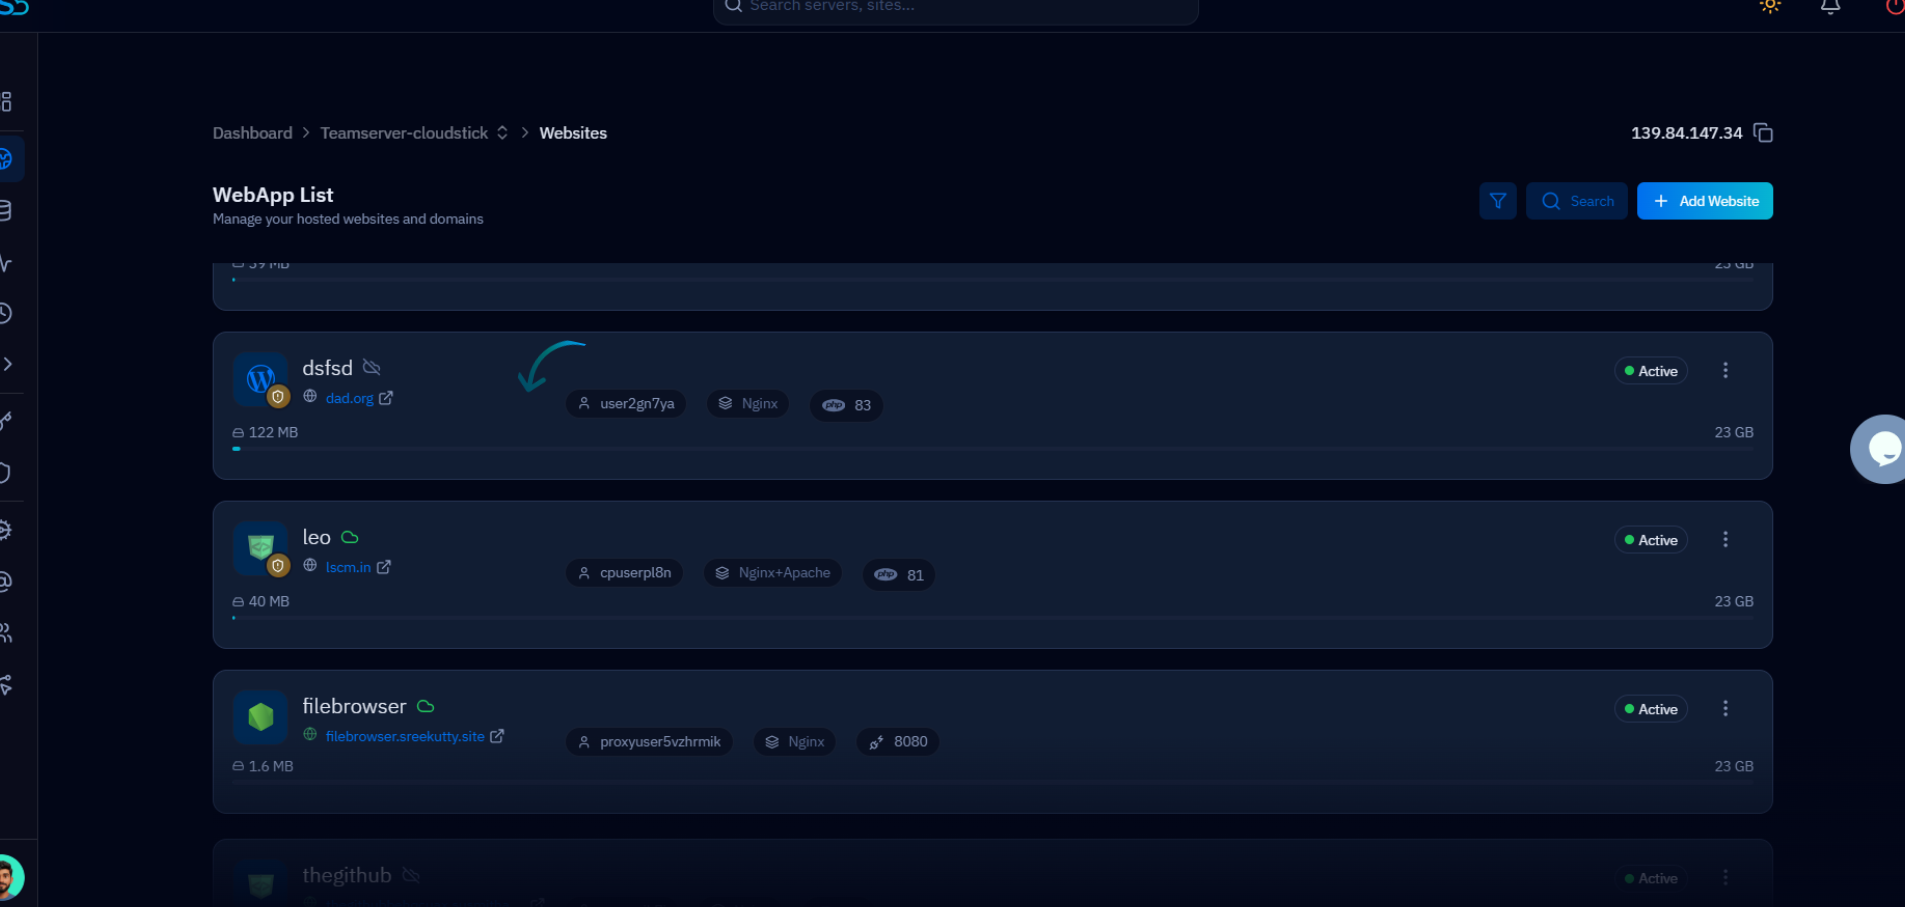
Fig. 02 — WebApp List showing all websites on the server. Click the WordPress site to open its management view.
Step 3: Open WordPress Manager
The Website Summary page gives you a full overview of your site health and configuration. From here, access WordPress Manager to reach WordPress-specific controls.
1. Open WordPress Manager: Click the WordPress Manager tab at the top of the page, or scroll down to the WordPress Manager section on the Website Summary page.
2. Stay on the General tab: The General tab opens by default — this is where the Debugging toggle is located.
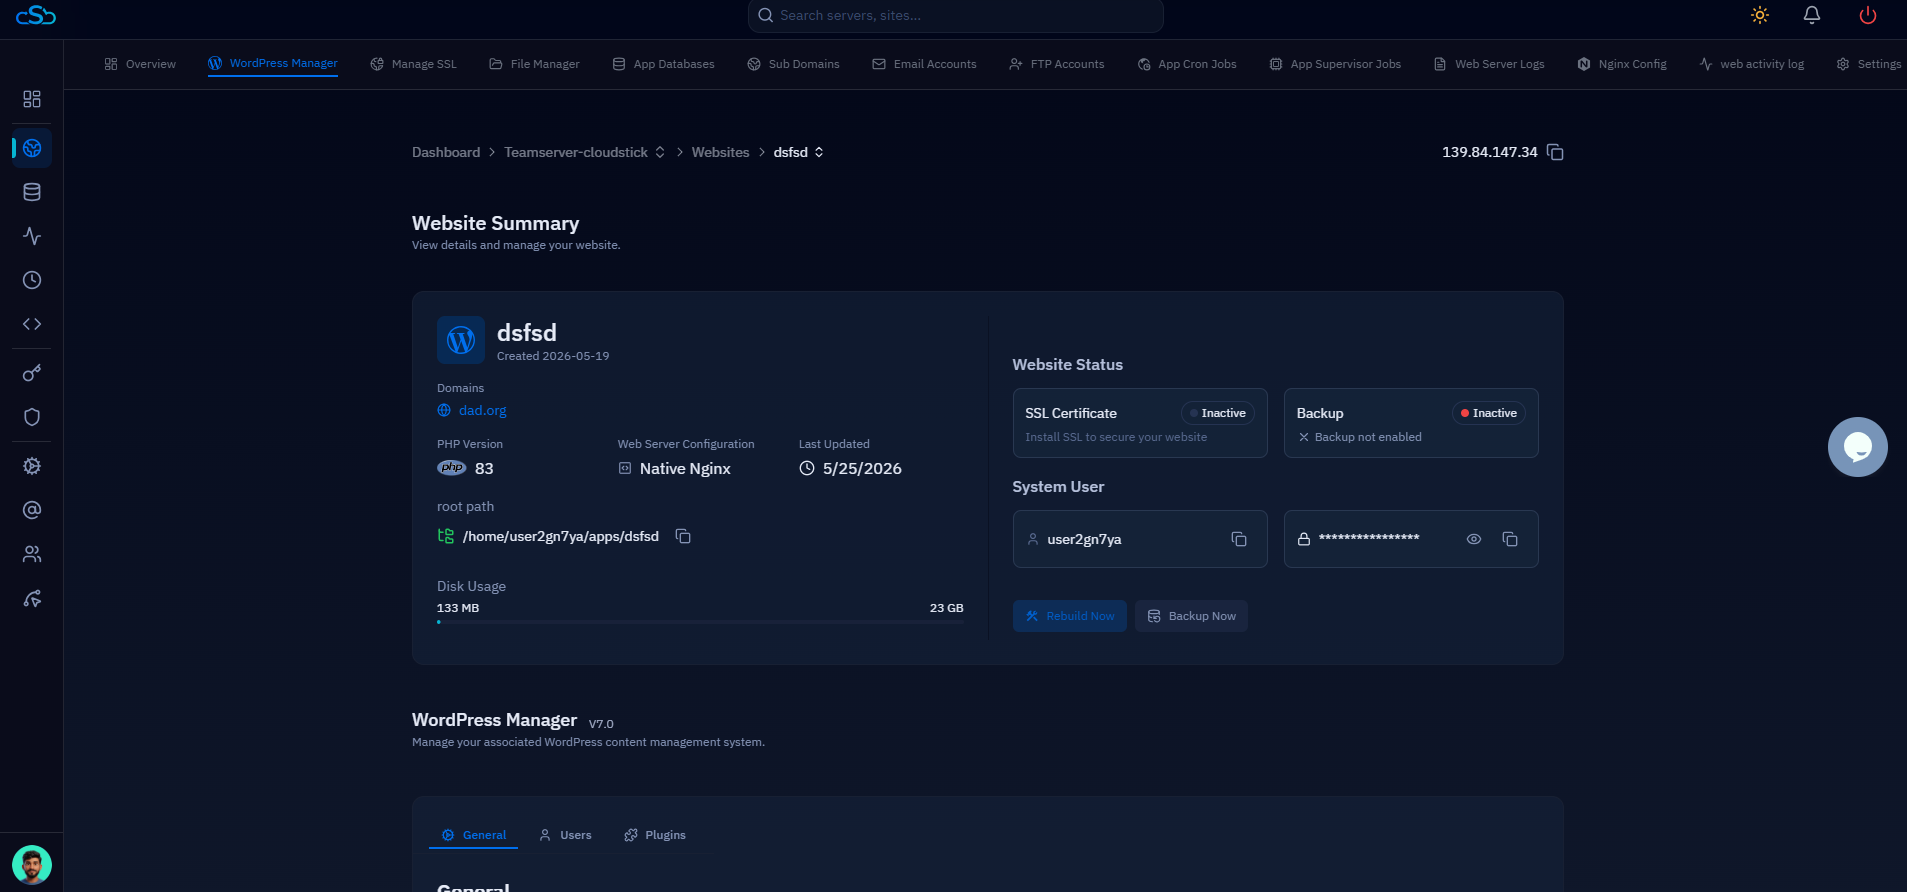
Fig. 03 — Website Summary page showing the WordPress Manager section at the bottom. Click WordPress Manager to access site-level controls.
Step 4: Enable Debugging
Scroll down the General tab to the Visibility & Tools section, which contains controls for debugging, maintenance mode, and search engine visibility.
1. Scroll to Visibility & Tools: In the WordPress Manager General tab, scroll past Site URL, Home URL, and Site Status to reach the Visibility & Tools section.
2. Toggle Debugging on: Find the Debugging row — labelled "Enable WordPress debugging to log errors." — and click the toggle to enable it.
3. Confirm activation: The toggle turns active (blue) when enabled. WordPress will now log errors to a debug log file on your server, which you can review via File Manager or SSH.
WordPress debug logs are written to wp-content/debug.log on your server. You can view this file using the CloudStick File Manager or over SFTP. Remember to disable Debugging once your issue is resolved.
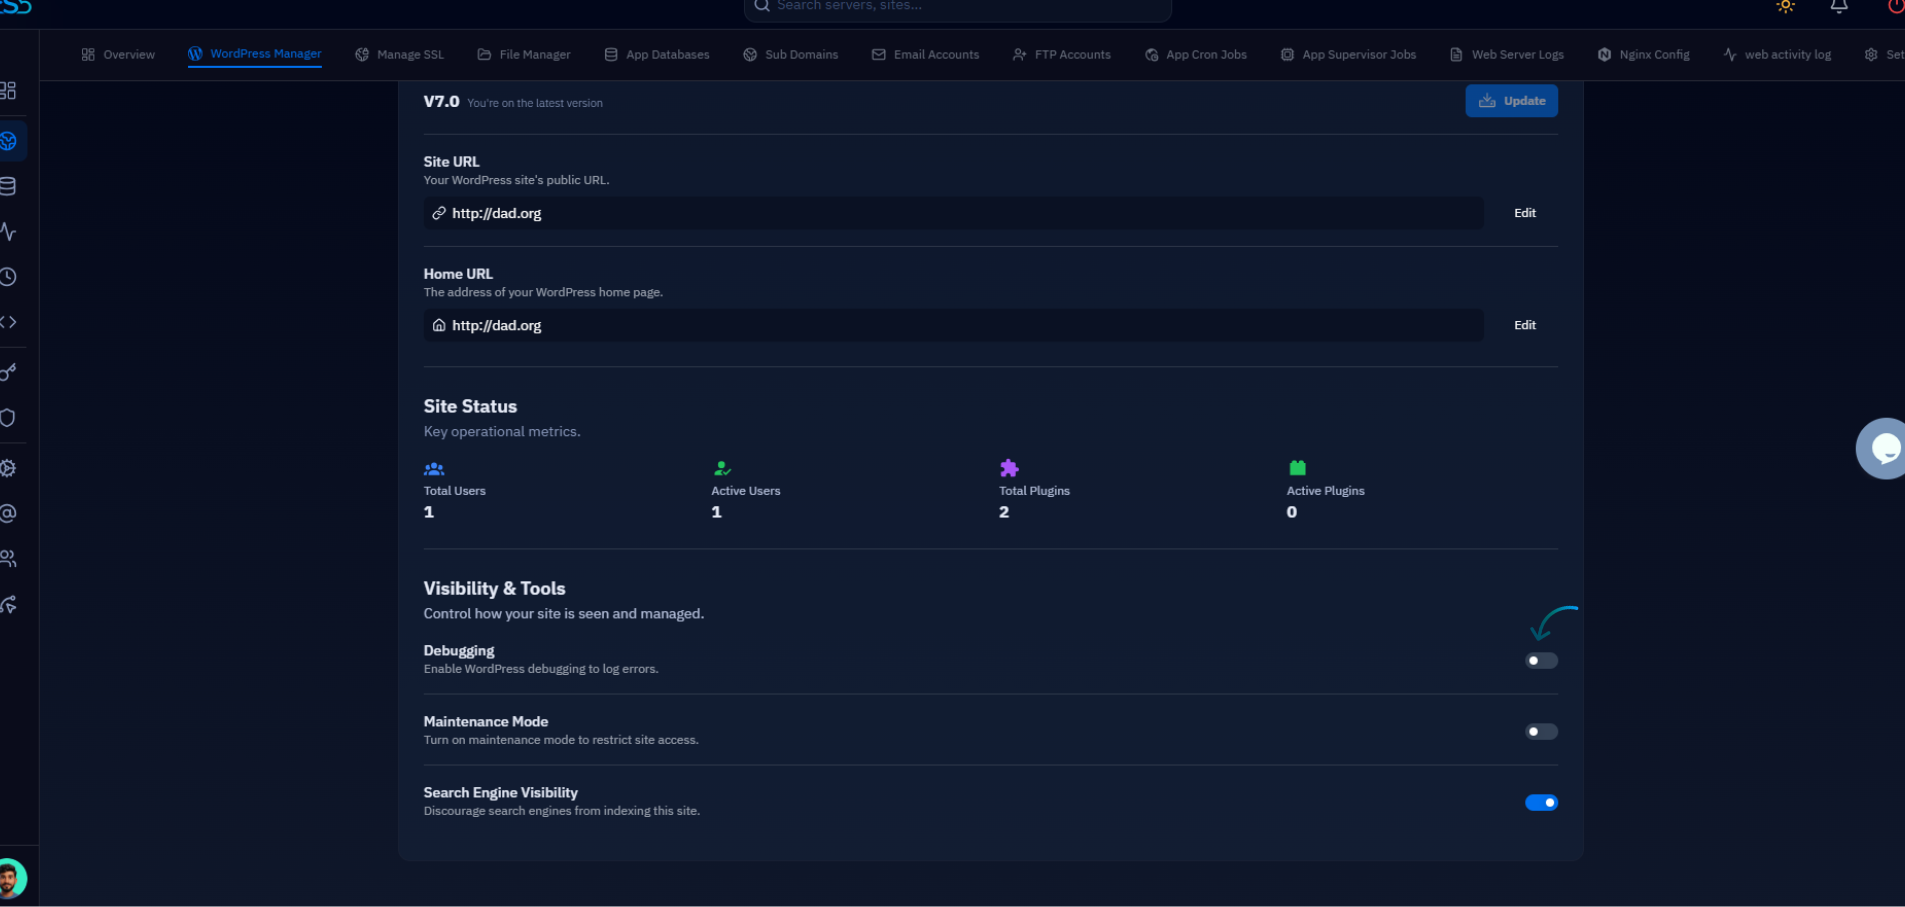
Fig. 04 — WordPress Manager General tab showing the Visibility & Tools section with the Debugging toggle highlighted.