How to Access Web Server Logs in CloudStick
Overview
Web server logs are your first line of insight when something goes wrong — or when you want to understand how traffic is flowing through your application. CloudStick surfaces NGINX Access logs and NGINX Error logs directly in the dashboard, so you can monitor successful and failed requests and diagnose issues without needing SSH access or command-line tools.
This guide walks you through navigating to the Web Server Logs section for any website on your server, so you can view real-time and historical log data in just a few clicks.
Web Application Logs are available on all CloudStick plans. Make sure your server is connected and the website is active before following these steps.
Step 1: Log In and Select Your Server
Log data is tied to a specific server, so the first step is to navigate to the correct server from your CloudStick dashboard.
Log in to your CloudStick account: Visit app.cloudstick.io and sign in with your credentials.
Select your server: From the main dashboard, locate the server card that hosts the website you want to inspect, then click Manage to open its server panel.
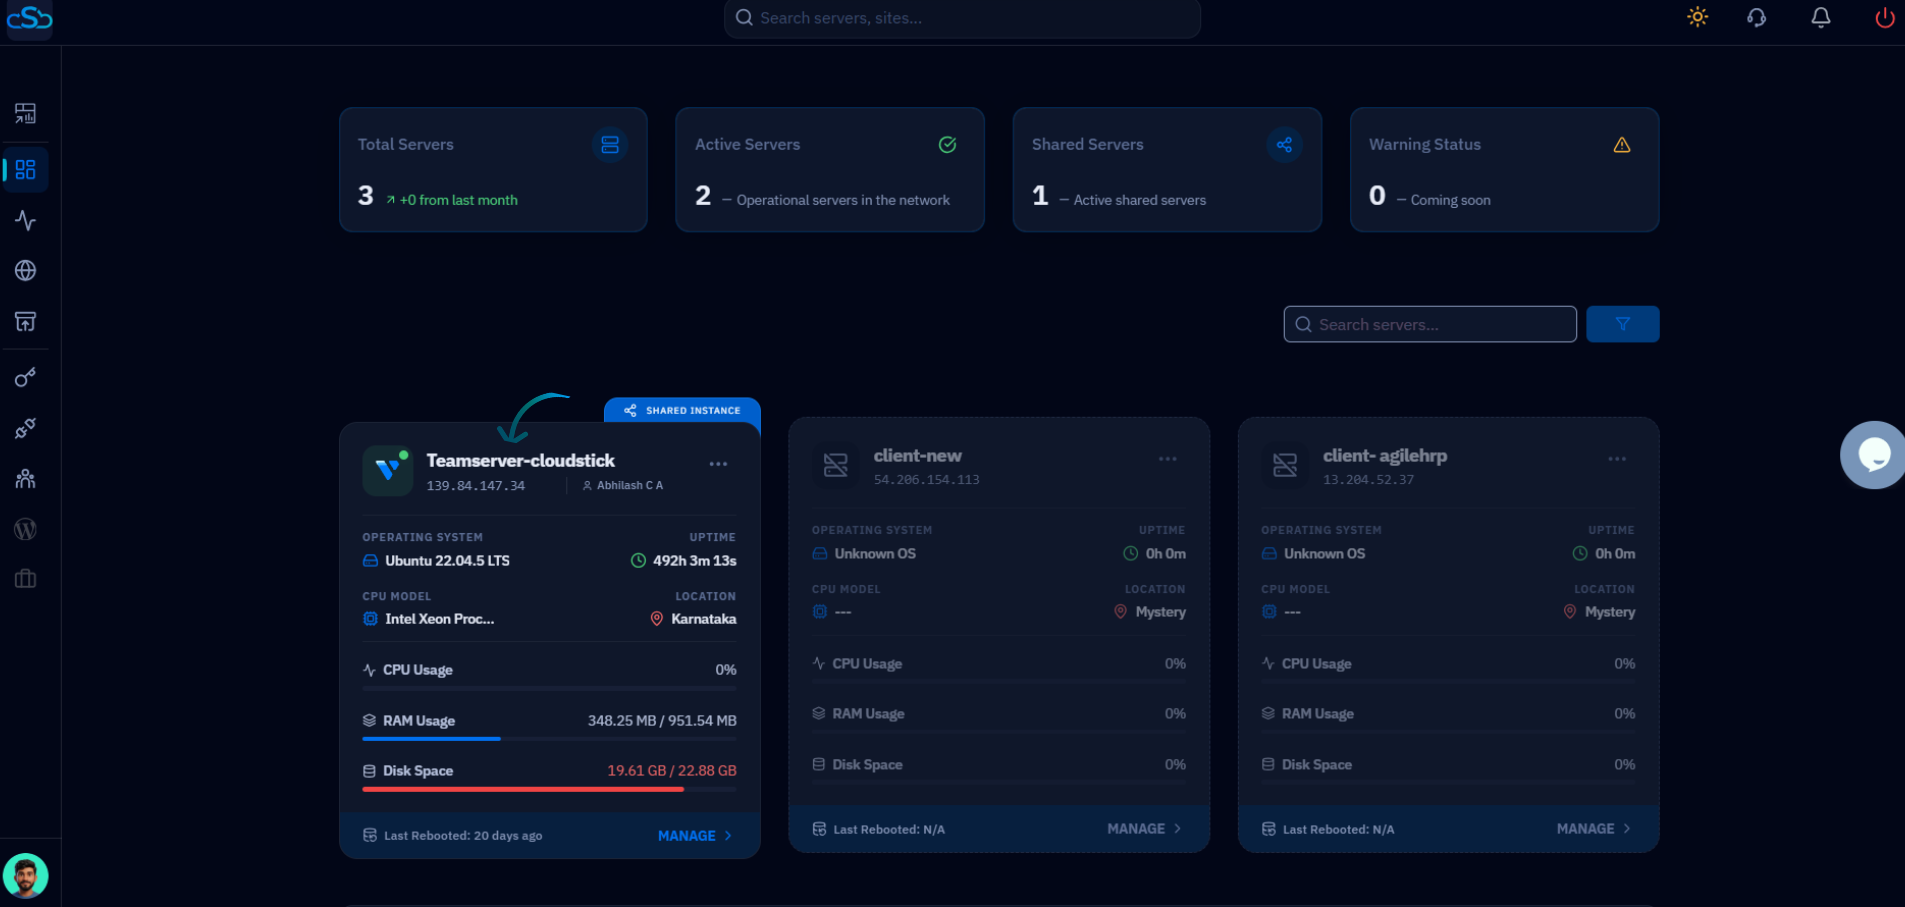
Fig. 01 — CloudStick dashboard showing connected servers. Click Manage on the server hosting the website whose logs you want to view.
Step 2: Navigate to the Websites Section
Web server logs are accessed per website, so you need to open the Websites section of the server panel first.
Click on Websites: In the Server Resources area of the server panel, click the Websites card to open the WebApp List — a full listing of all web applications hosted on this server.
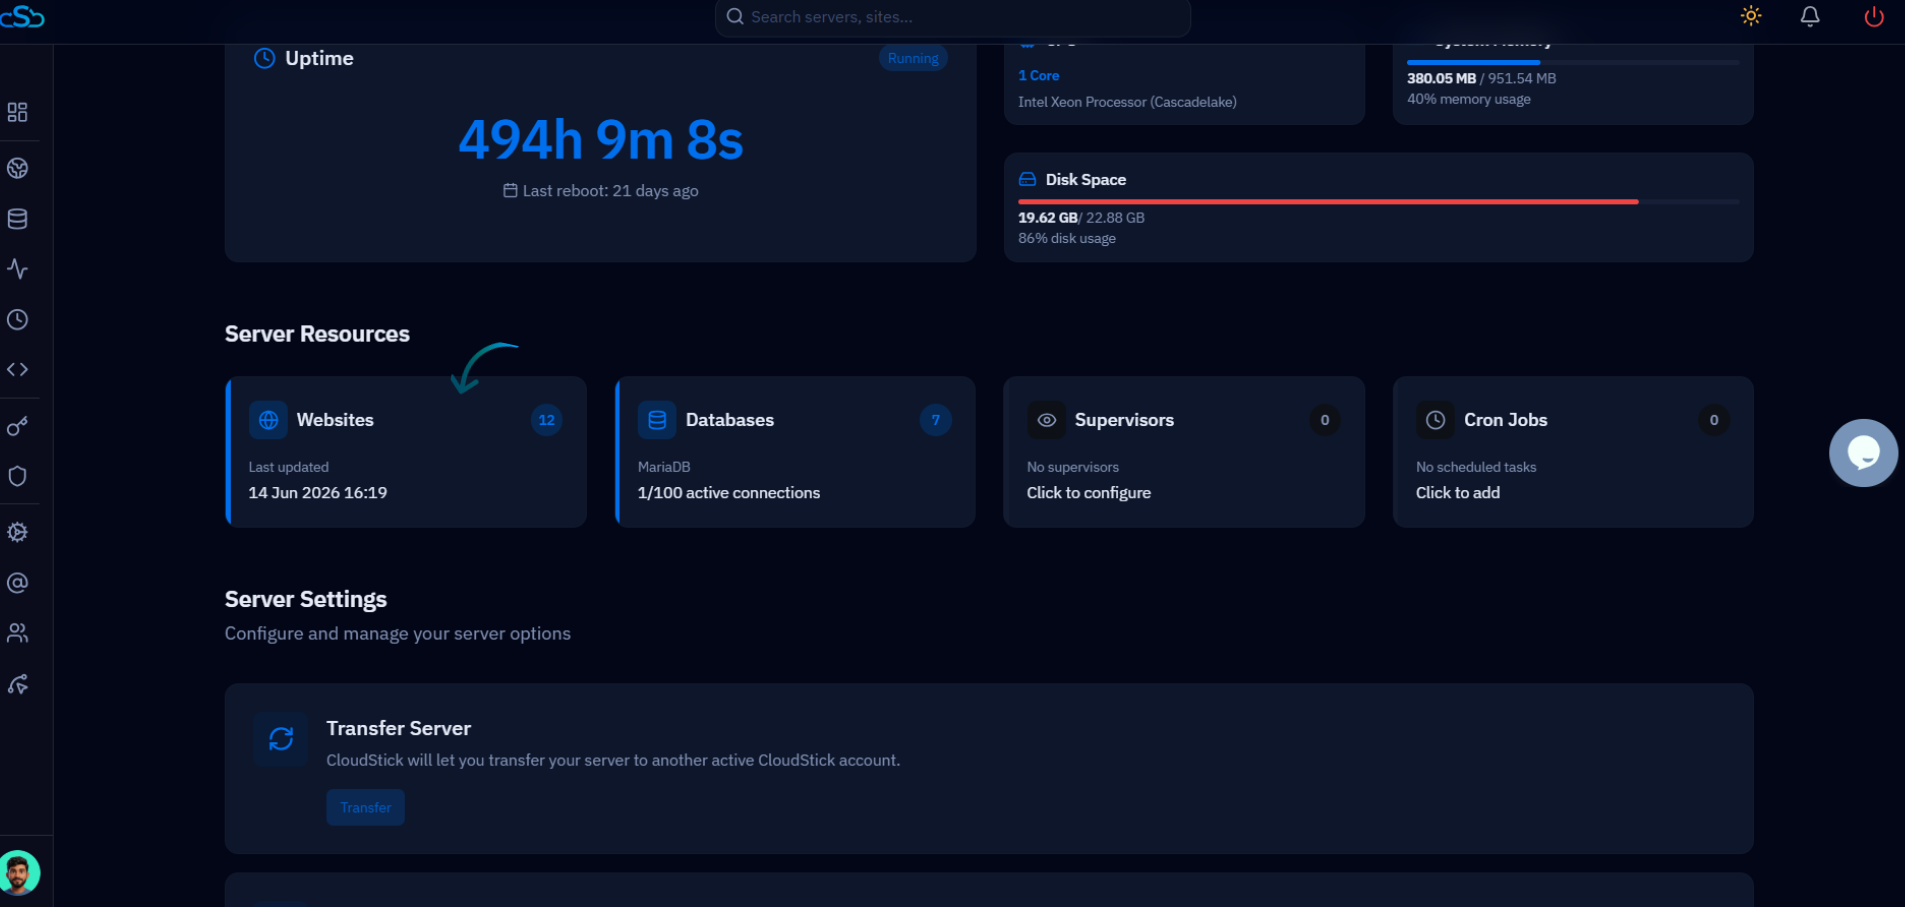
Fig. 02 — Server panel showing the Websites card under Server Resources. Click it to navigate to the WebApp List.
Step 3: Select Your Website
The WebApp List displays every website running on the server. Select the specific site whose logs you need to review.
Find your website: Browse the list of web applications. Each entry shows the site name, domain, web stack (Nginx or OpenLiteSpeed), and current status.
Click the website name: Click on the name of the website you want to inspect. This opens the website's individual management view with its full set of tabs.
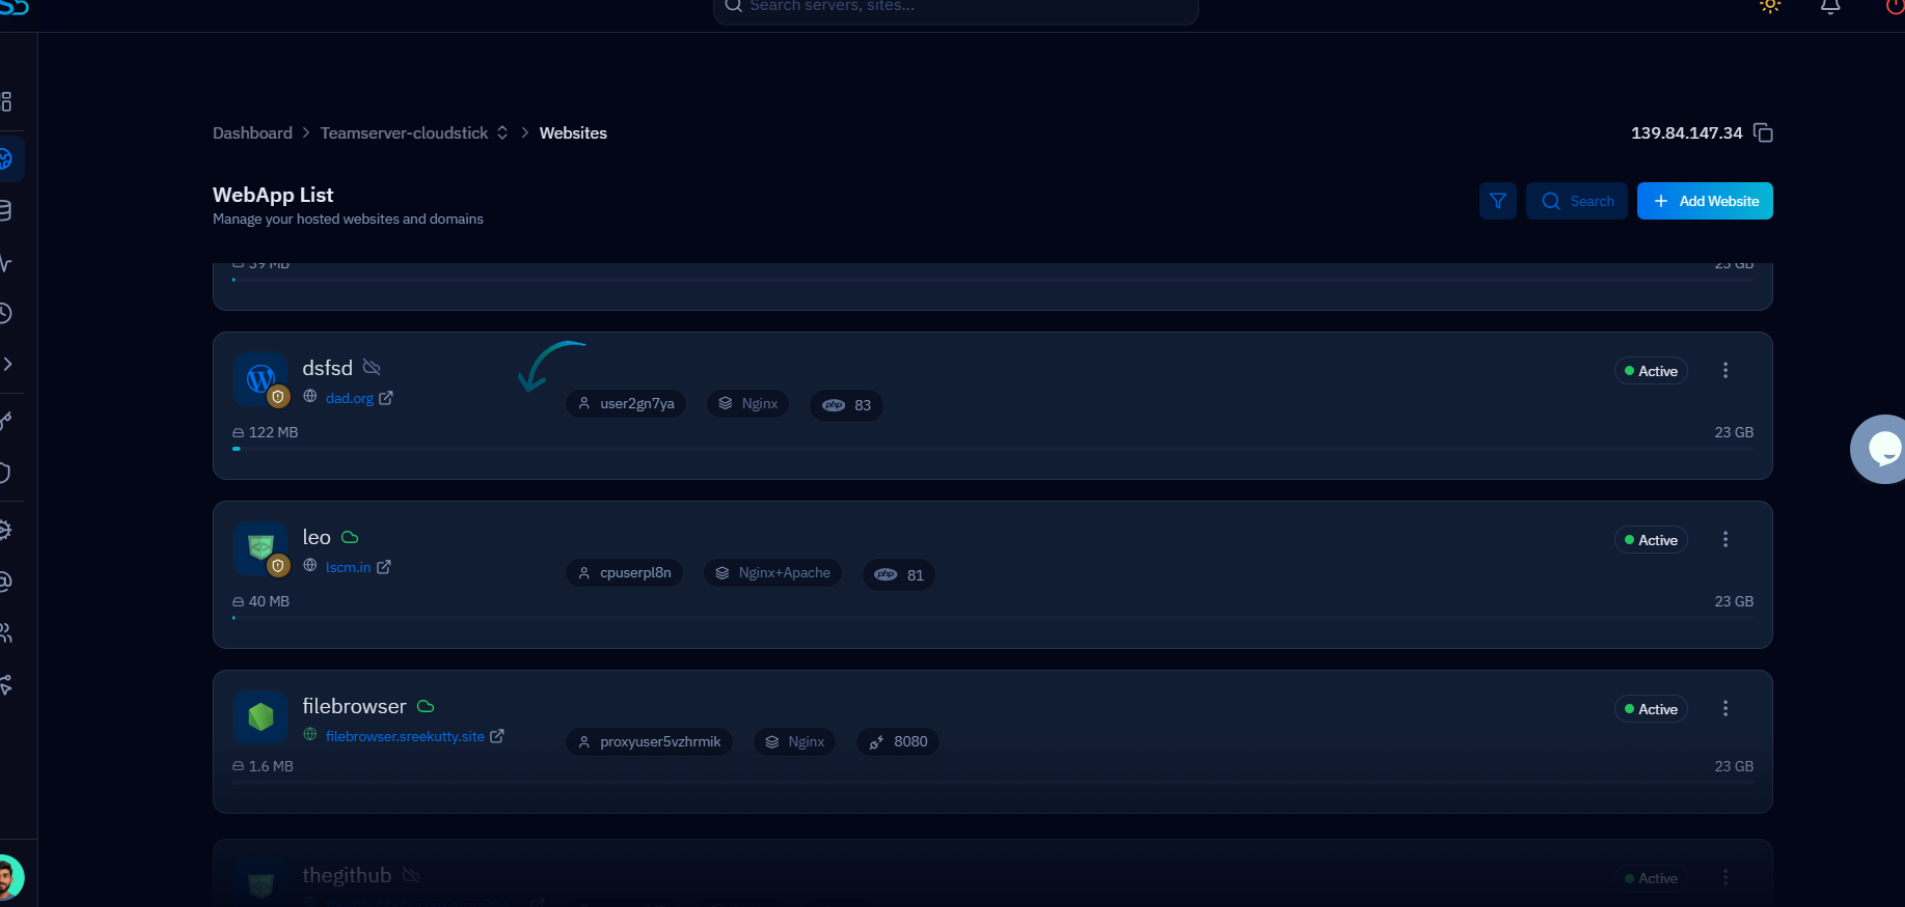
Fig. 03 — WebApp List displaying all hosted websites. Click the website name to open its management view.
Step 4: Open the Web Server Logs Tab
Inside the website management view, a row of tabs spans the top of the page. The Web Server Logs tab gives you direct access to both access and error log streams for this specific website.
Click the Web Server Logs tab: Locate and click the Web Server Logs tab in the top navigation bar of the website management view.
View NGINX Access logs: Click the View button next to NGINX Access to open the access log stream. This shows all successful and unsuccessful HTTP requests made to your website — useful for monitoring traffic patterns and identifying unusual activity.
View NGINX Error logs: Click the View button next to NGINX Error to open the error log stream. This shows diagnostic information and error events — the most useful log when troubleshooting a broken page, a PHP error, or a configuration issue.
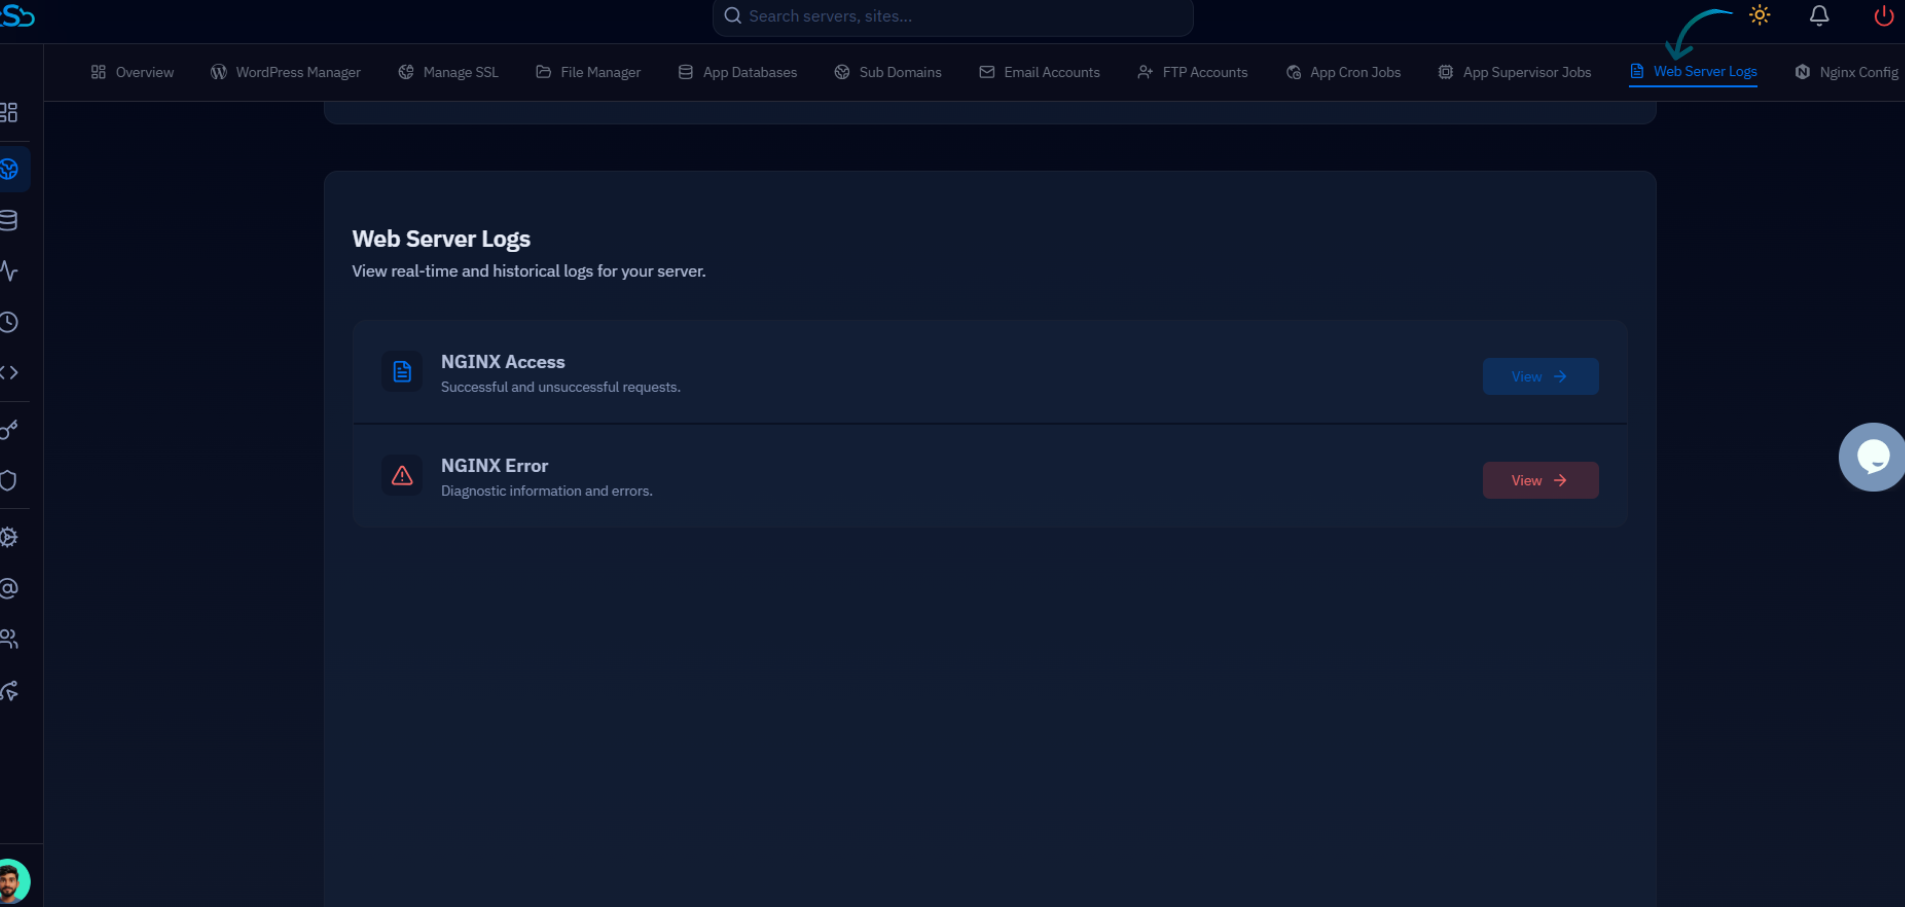
Fig. 04 — Web Server Logs tab showing NGINX Access and NGINX Error log options, each with a View button to open the respective log stream.
Both log streams are available in real-time and include historical entries. Use NGINX Access for traffic analysis and NGINX Error for debugging application or server configuration problems.