How to View System Overview
Overview
Keeping an eye on your server's health is one of the most important parts of managing production infrastructure. The System Overview section in CloudStick gives you an at-a-glance view of how your server is performing — including how long it has been running, how much processing power it is using, and how much memory and disk space remain available.
This guide shows you how to open the System Overview for any connected server and read its key performance metrics — all from the CloudStick dashboard, without needing SSH access or command-line tools.
You need at least one server connected to your CloudStick account to view its System Overview. If you have not added a server yet, see How to Deploy Your Own Server first.
Step 1: Log In to CloudStick
Start by signing in so you can reach the dashboard where all of your connected servers are listed.
1. Log in: Sign in to your CloudStick account at app.cloudstick.io using your email and password.
2. Land on the Dashboard: After logging in, you are taken to the main Dashboard, which greets you and shows a summary of your total, active, and shared servers.
Step 2: Select Your Server
Choose the server whose performance you want to inspect to open its dedicated server panel.
1. Find your server: From the Dashboard, locate the server you want to monitor among the server cards. Each card shows the operating system, uptime, CPU model, and live resource usage.
2. Open the server panel: Click the server card (or the Manage option on it) to open that server's management view.
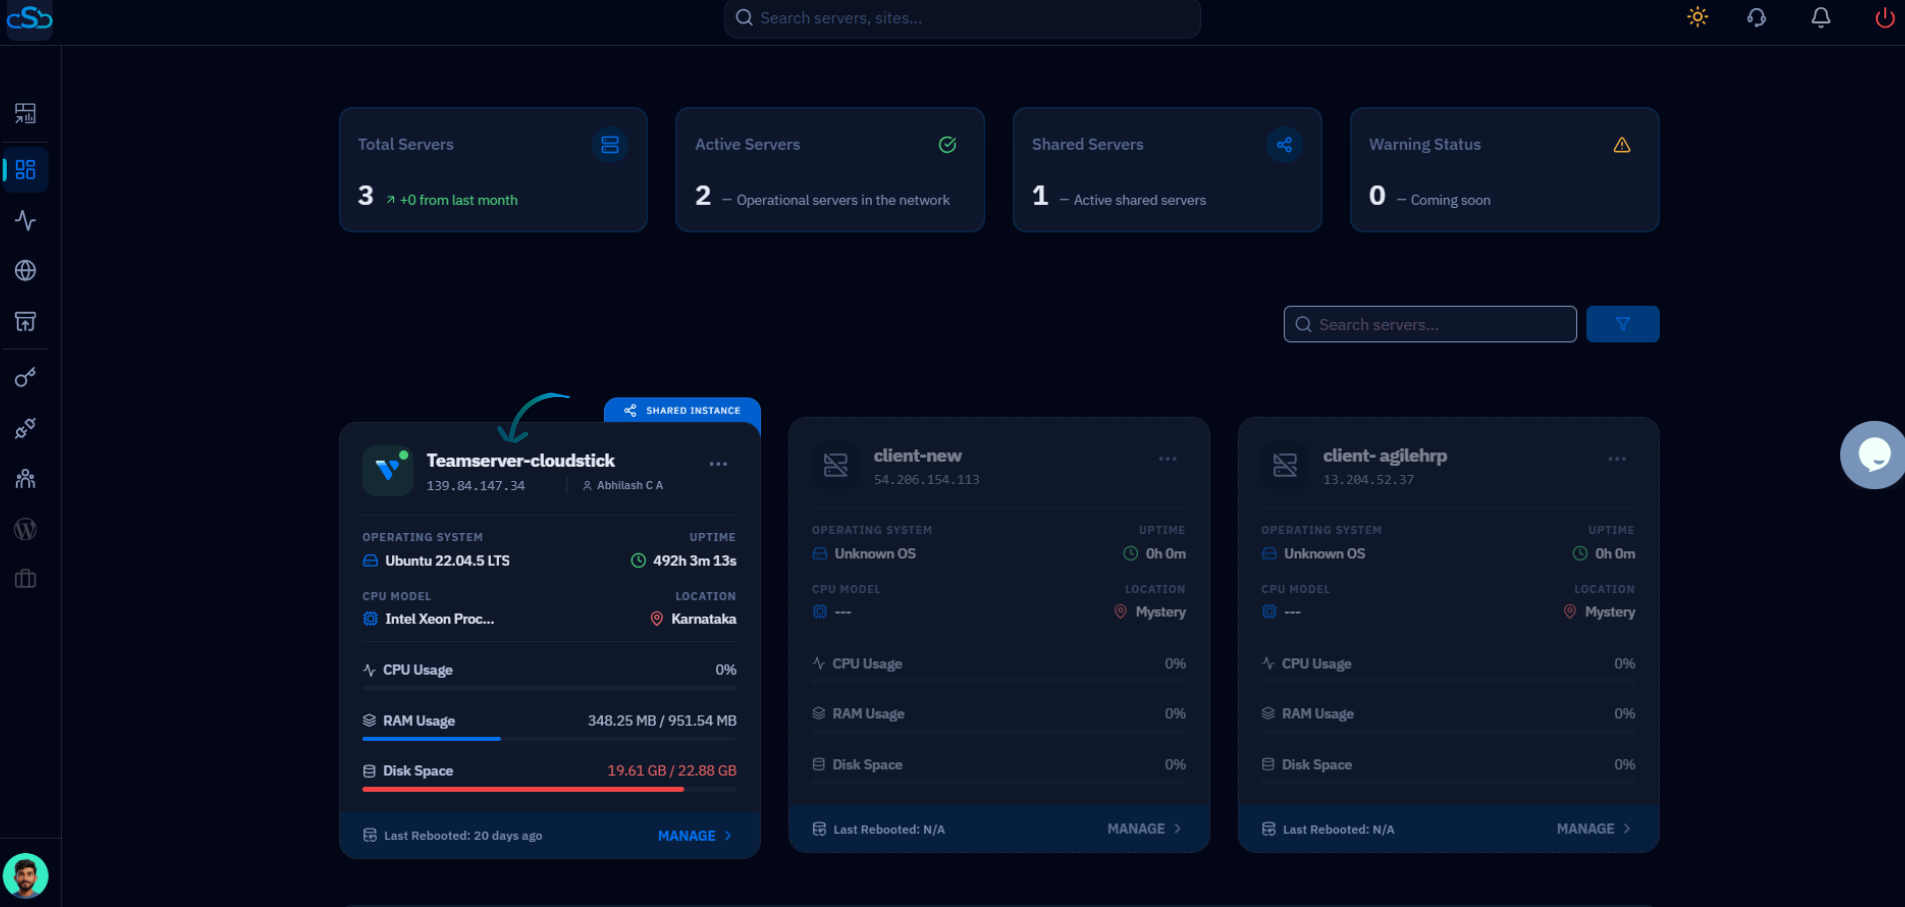
Fig. 01 — The Dashboard server list. Select the server you want to monitor to open its server panel.
Step 3: View Server Metrics
Inside the server panel, the System Overview section displays the core health metrics for your server in real time.
Uptime: How long the server has been running since its last reboot, along with the date of the last restart.
CPU Usage: The number of CPU cores and the processor model powering the server.
System Memory (RAM): The amount of memory currently in use against the total available, shown as a percentage.
Disk Space: How much storage is used against total capacity, with a usage bar that turns red as the disk fills up.
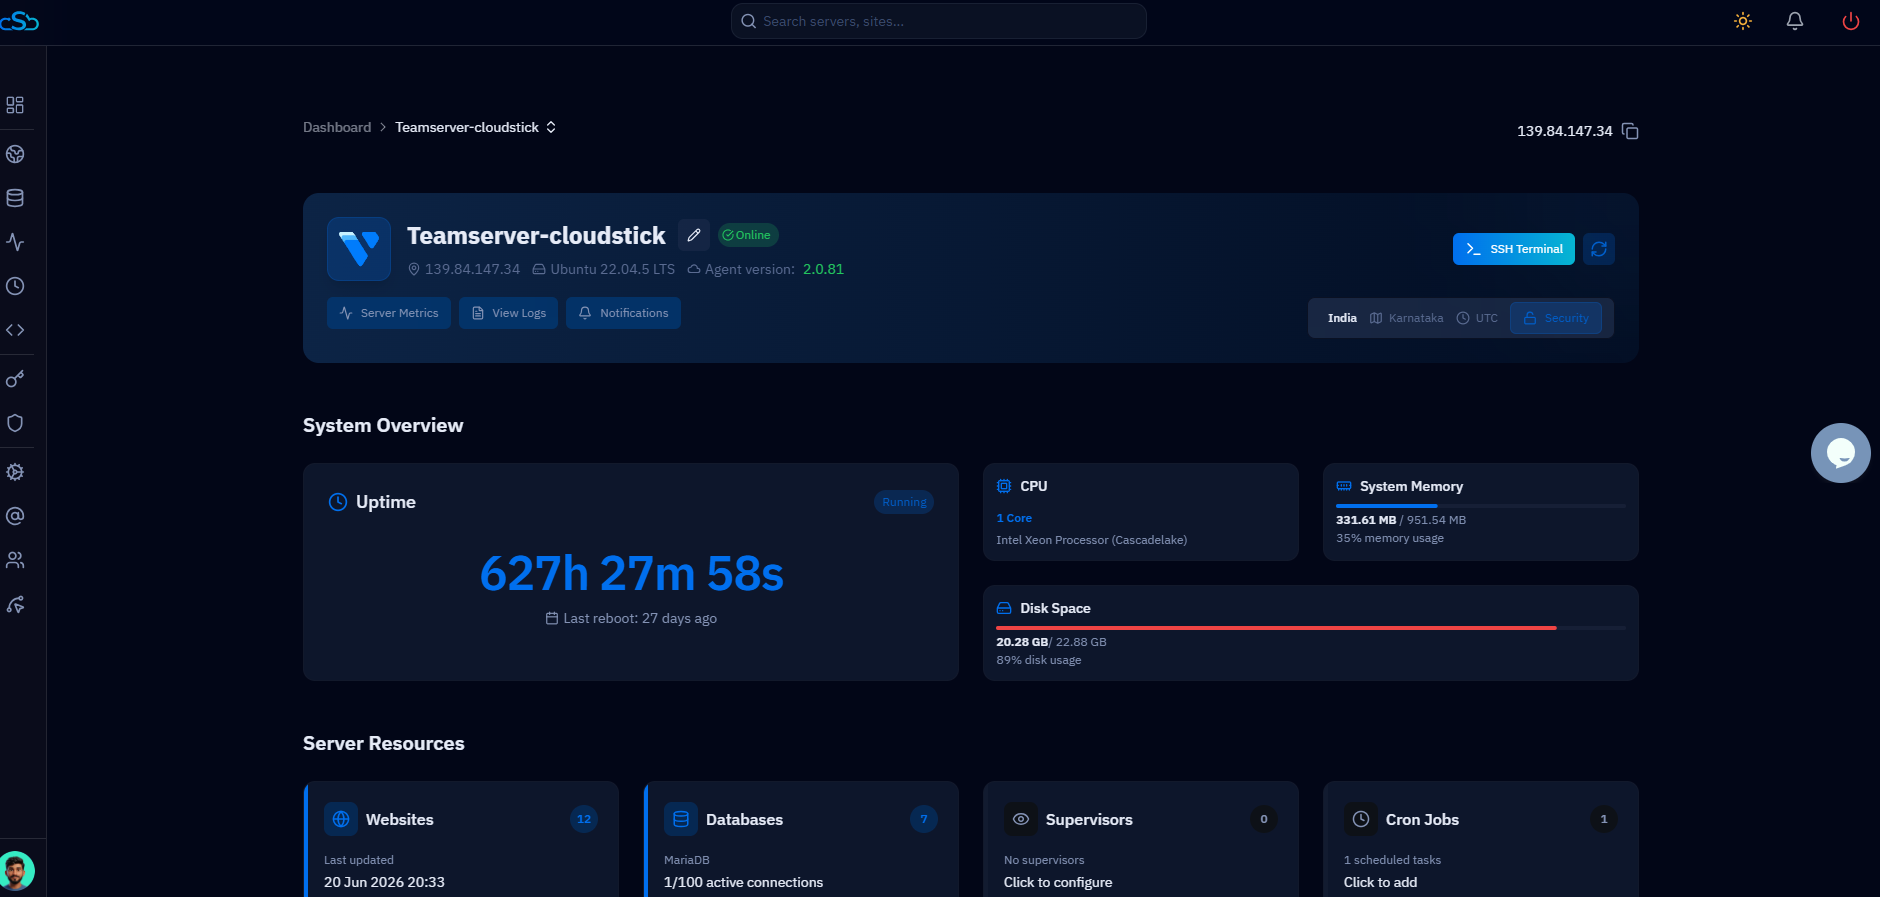
Fig. 02 — The System Overview section showing Uptime, CPU, System Memory, and Disk Space for the selected server.
The Server Resources cards below System Overview also summarize your Websites, Databases, Supervisors, and Cron Jobs for quick navigation.
Step 4: Monitor Performance
Use the System Overview as your day-to-day health check to catch problems before they affect your sites.
Watch trends: Revisit this section regularly to spot rising CPU, memory, or disk usage early.
Act on warnings: High disk or memory usage is a signal to clean up space, scale up, or investigate a runaway process before it causes downtime.
System Overview helps you quickly identify performance issues and ensures your server is running smoothly. If disk usage approaches capacity, free up space promptly to keep your websites and databases online.