How to Access Server Activity Logs
Overview
Every meaningful action taken on a CloudStick-managed server — website creation and deletion, cron jobs, database changes, CSF firewall edits, system user updates, service restarts, and security updates — is captured in the Server Activity Log's section. This gives you a single, chronological audit trail of what happened on your server, when it happened, and whether each action succeeded or failed.
Activity logs are invaluable for monitoring server changes, troubleshooting unexpected behaviour, and tracking the work of every team member with access. This guide shows you how to open the activity logs from the CloudStick dashboard and use the built-in filters to pinpoint exactly the events you need.
You must have an active server connected to your CloudStick account before you can view its activity logs. If you haven't connected a server yet, follow the How to install CloudStick on a cloud server guide first.
Step 1: Log In to CloudStick and Select the Server
Activity logs are scoped to a single server, so you first need to open the server you want to inspect.
1. Log in: Sign in to your CloudStick account at app.cloudstick.io.
2. Select the server: From the Dashboard, click on the server you want to monitor to open its server panel.
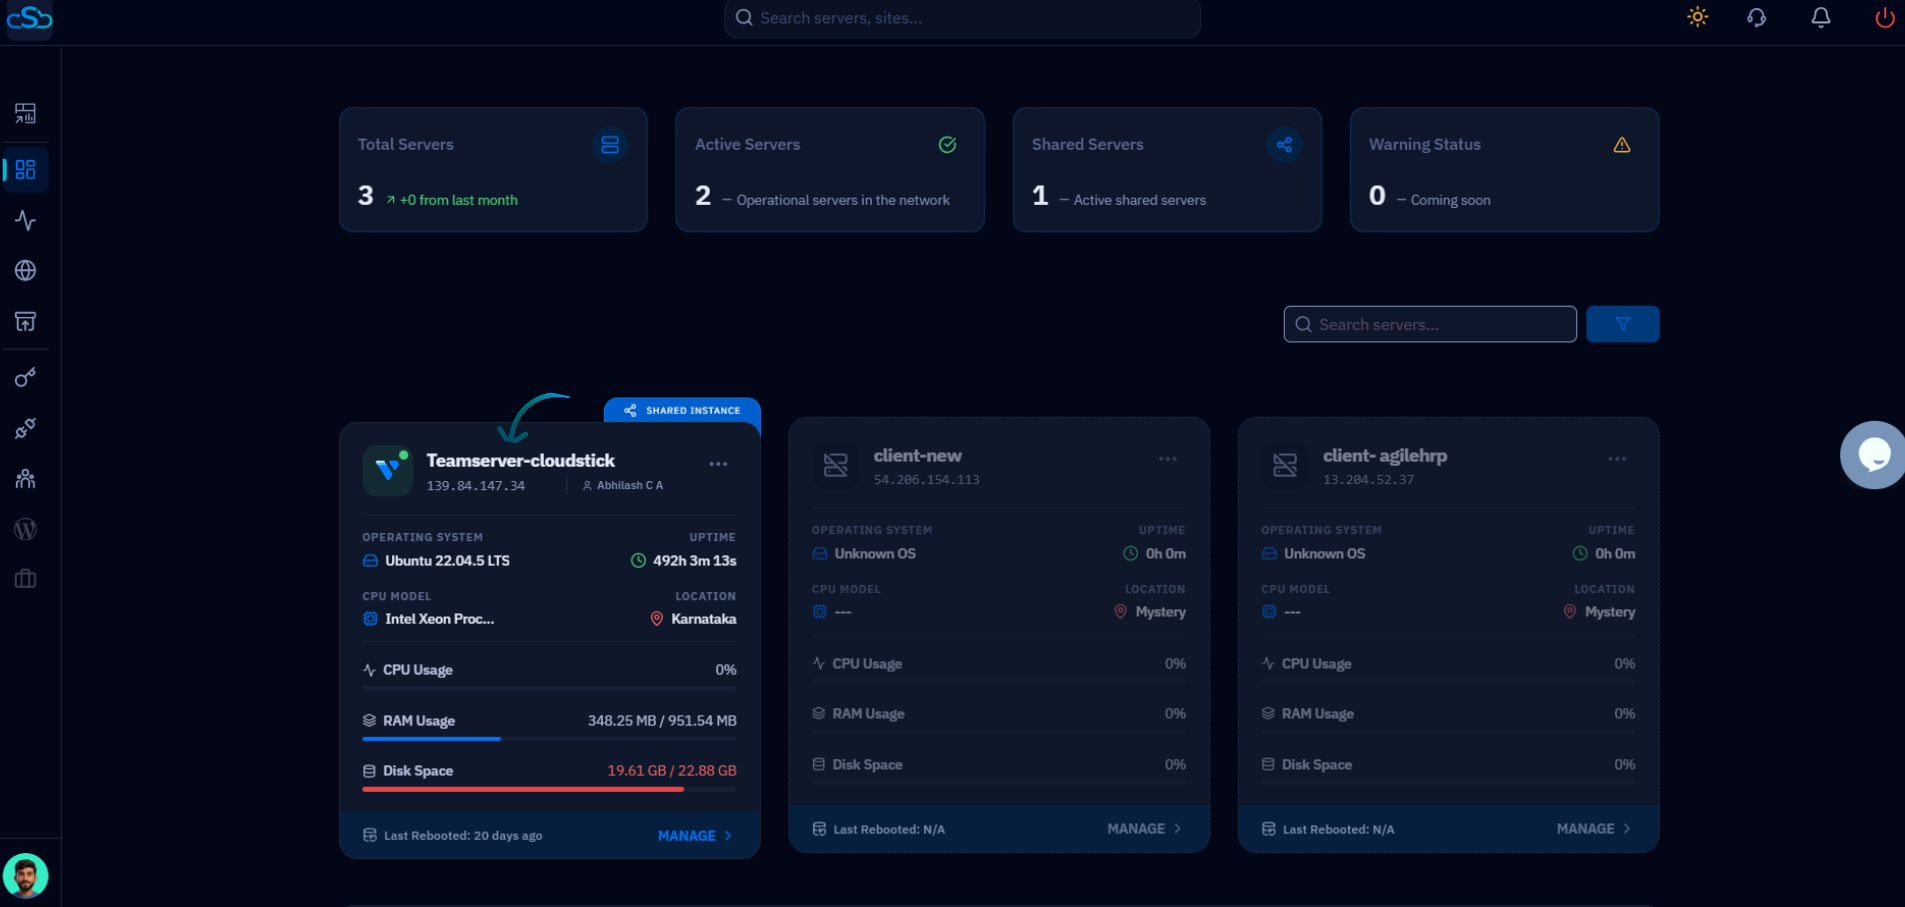
Fig. 01 — CloudStick Dashboard listing all connected servers; click a server card to open its panel.
Step 2: Open the Activity Logs
The activity logs live in the left-hand navigation of the server panel.
1. Open the Activity Logs section: From the left-side menu, click on Activity Logs (also labelled Server Activity Log's).
2. Review the timeline: CloudStick displays all recent server activities grouped by date, with a status indicator and timestamp for each event.
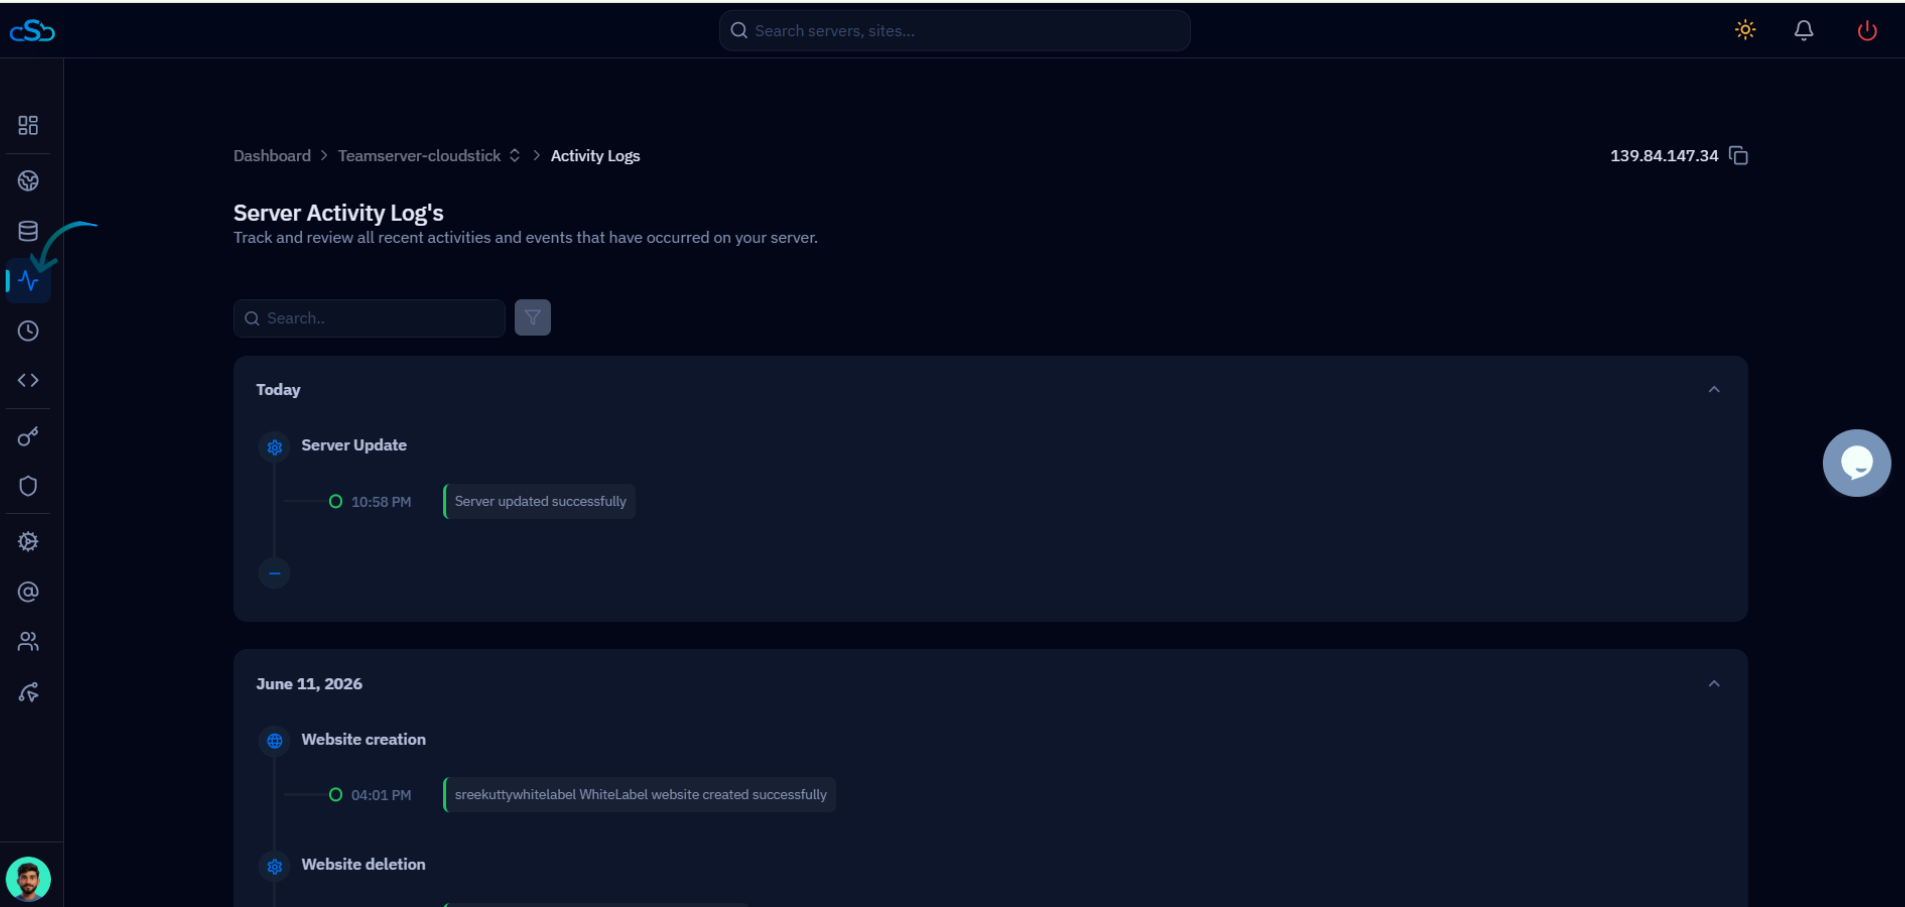
Fig. 02 — Server Activity Log's page showing events grouped by date, opened from the Activity Logs icon in the left navigation.
Step 3: Open the Filters
When a server has accumulated many events, the filter panel lets you narrow the timeline to only the entries you care about.
1. Click the Filter icon: Select the Filter option next to the search bar at the top of the Activity Logs page.
2. Choose a filter tab: The filter panel opens with three tabs — Time Period, Status, and Activity Type — which can be combined.
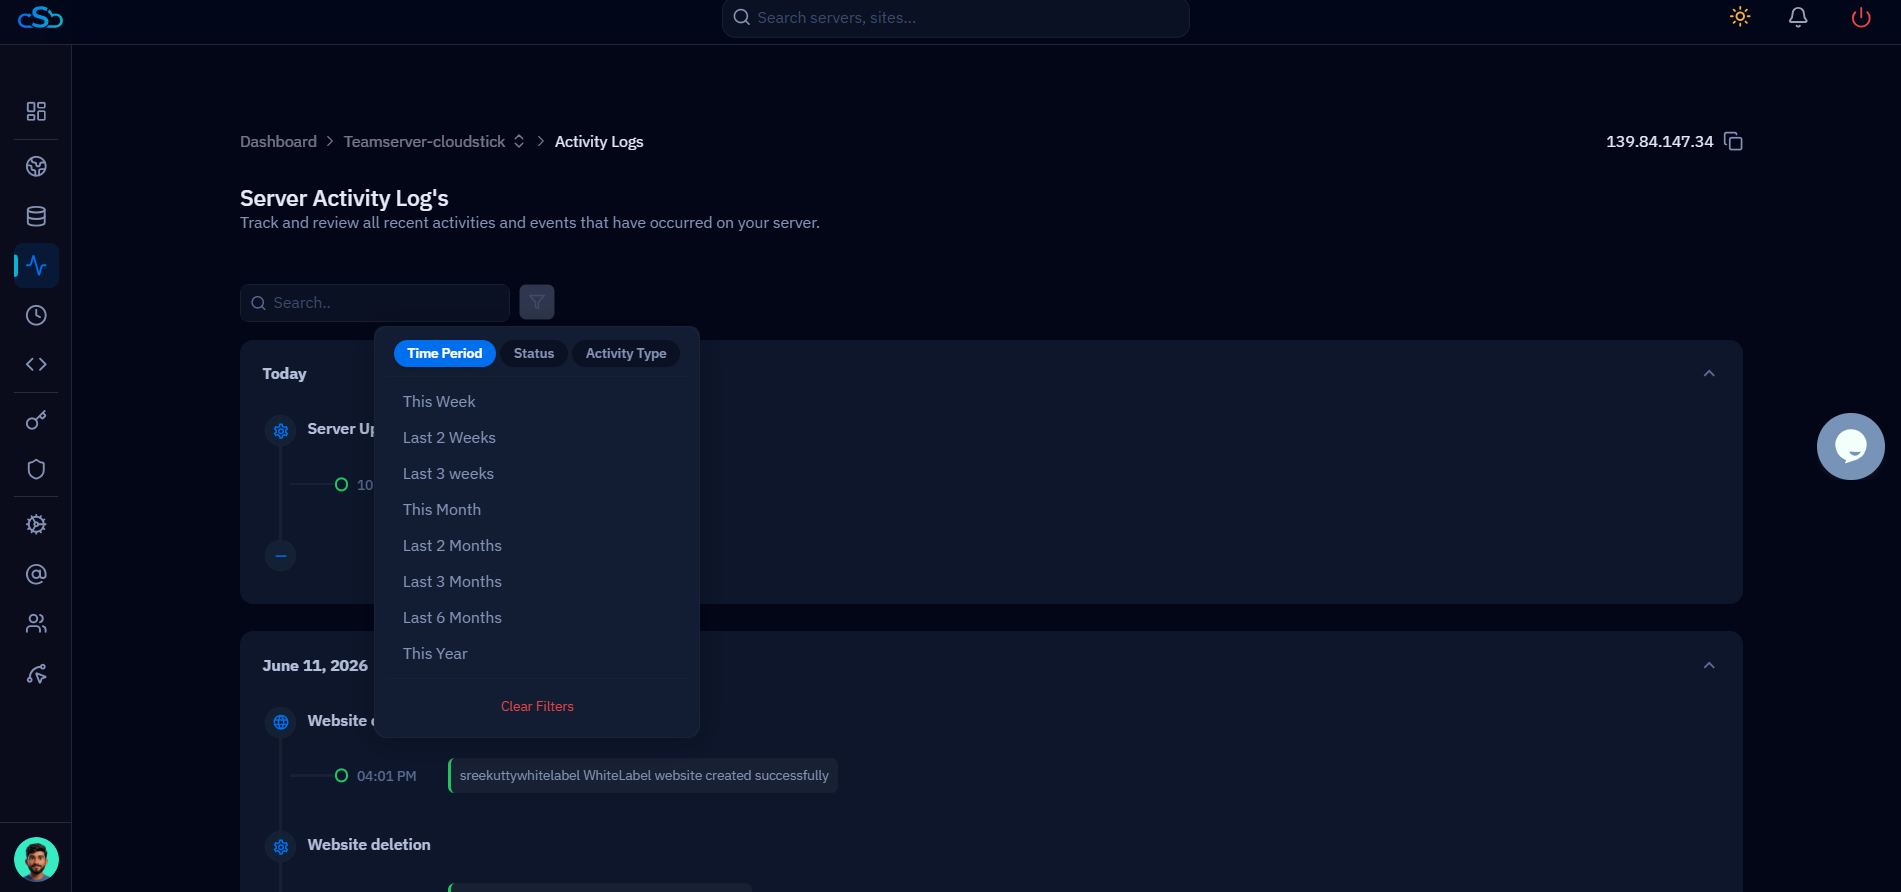
Fig. 03 — The filter panel open on the Time Period tab, offering ranges from This Week to This Year.
Step 4: View and Filter the Logs
Apply one or more filters to refine the activity timeline to a specific window, outcome, or type of action.
Available Filters
Time Period: Limit the log to a date range such as This Week, Last 2 Weeks, This Month, or This Year — ideal when investigating an incident that happened at a known time.
Status: Filter entries by outcome — Success or Failed — to quickly surface only the problematic actions.
Activity Type: Narrow results to a specific class of action, such as Website creation, Website deletion, Cron Job, Database, CSF, System user, or Service.
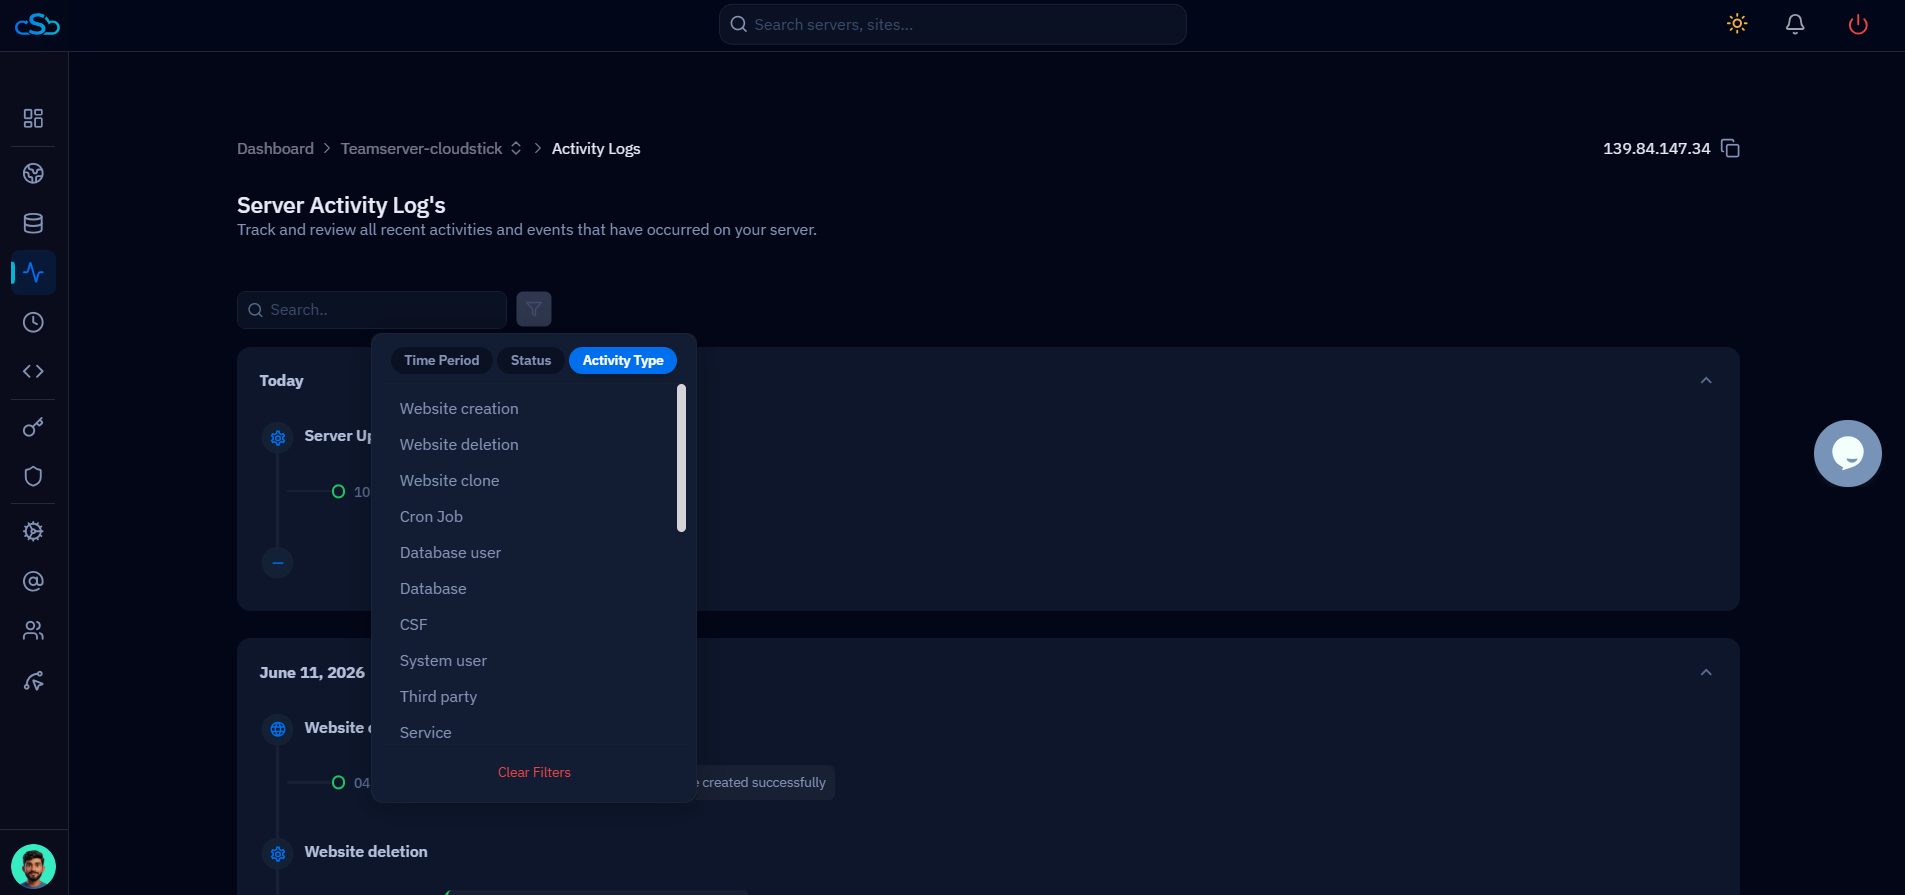
Fig. 04 — The Activity Type tab listing the categories of server events you can filter by.
Filters are applied in combination. For example, choosing Status: "Failed" together with Activity Type: "CSF" shows only failed firewall actions — not all failures and not all firewall events.
Step 5: Find Specific Events
With filters applied, you can quickly locate specific server events and track administrative actions over time.
1. Combine filters and search: Use the Time Period, Status, and Activity Type filters alongside the search bar to zero in on the exact events you need.
2. Track account-level logins separately: Server activity logs cover actions on the server itself. To review who signed in to your CloudStick account, open Profile and click Login Activity for your account's login history.
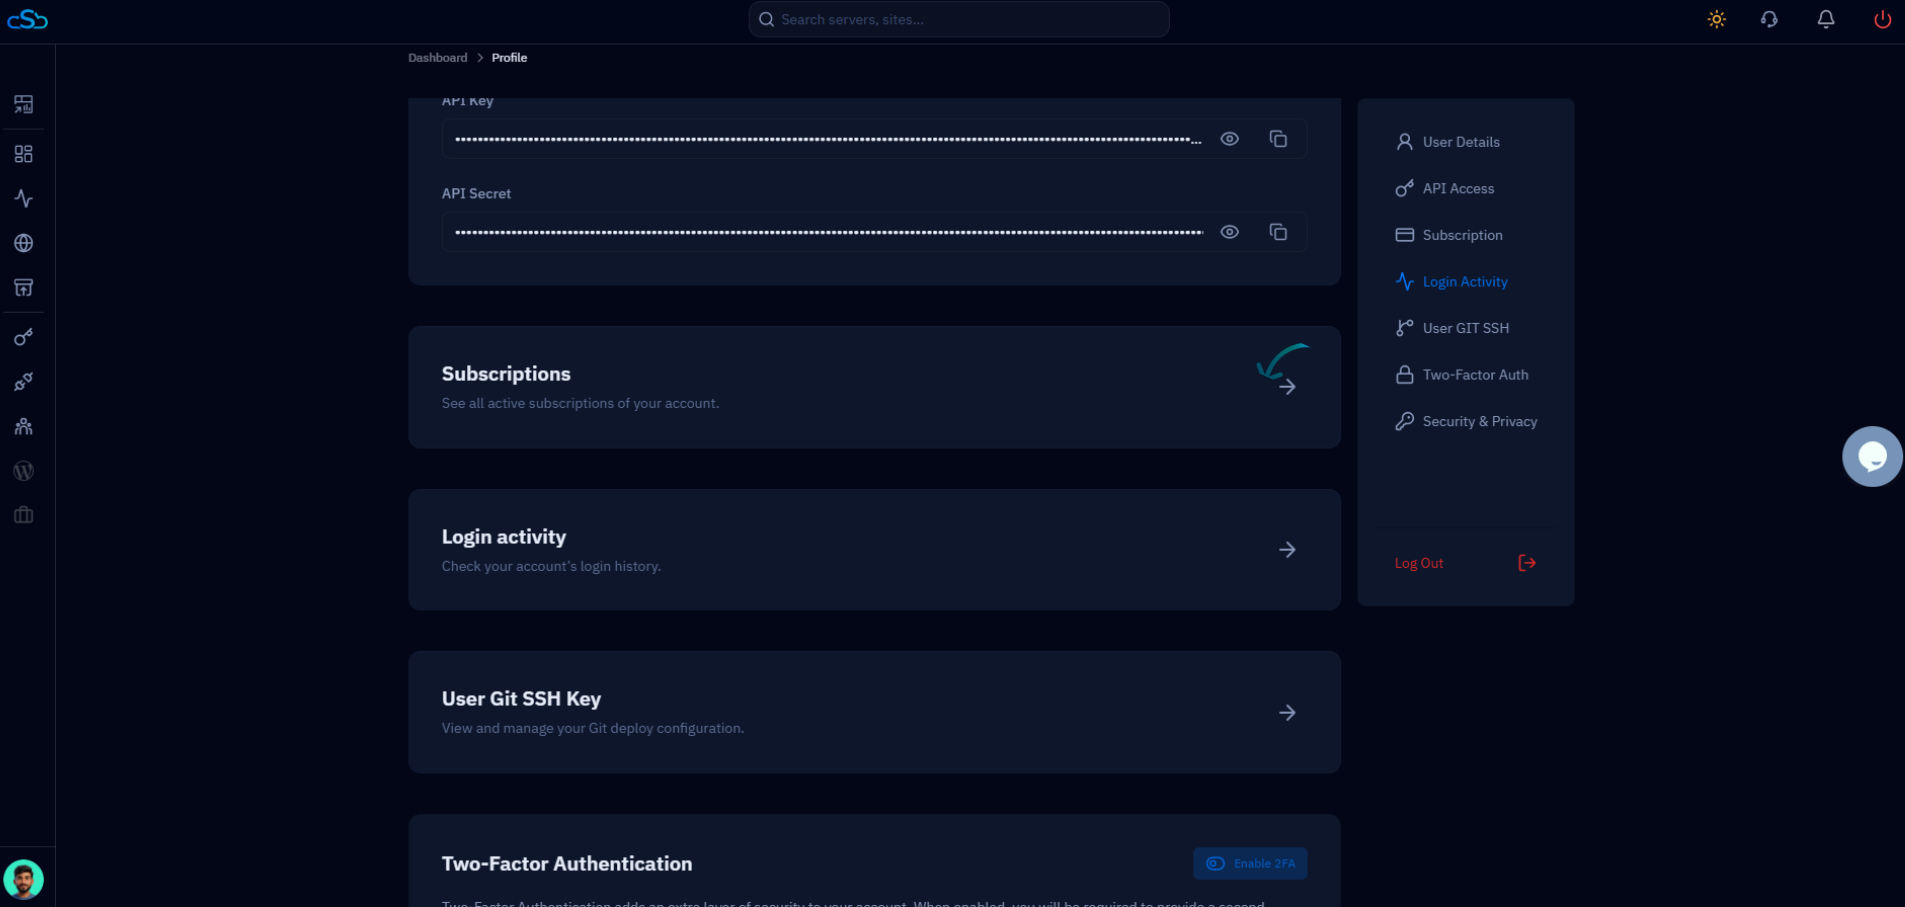
Fig. 05 — The Profile page, where Login Activity records your CloudStick account's sign-in history, complementing the server activity logs.
Activity logs help you monitor server changes, troubleshoot issues, and keep a record of every administrative action in one place.