How to View Website Activity Logs (Web Application)
Overview
CloudStick automatically records every significant event that occurs on your web applications — from deployments and configuration changes to errors and status updates. The Activity Logs section gives you a chronological, filterable view of these events, so you can quickly understand what changed, when it changed, and whether it succeeded or failed.
This guide walks you through opening the Activity Logs for any web application on your server, and using the built-in filters to zero in on exactly the events you need.
You must have an active server connected to your CloudStick account before accessing web application logs. If you haven't connected a server yet, follow the How to Deploy Your Own Server guide first.
Step 1: Navigate to Your Web Application
Activity logs are scoped per web application — you need to open the specific site you want to inspect before you can see its events.
1. Log in to your CloudStick Dashboard: Go to app.cloudstick.io and sign in with your credentials.
2. Open the Websites section: From the left-hand navigation inside your server panel, click on Websites. You will see the WebApp List — a list of all sites hosted on that server.
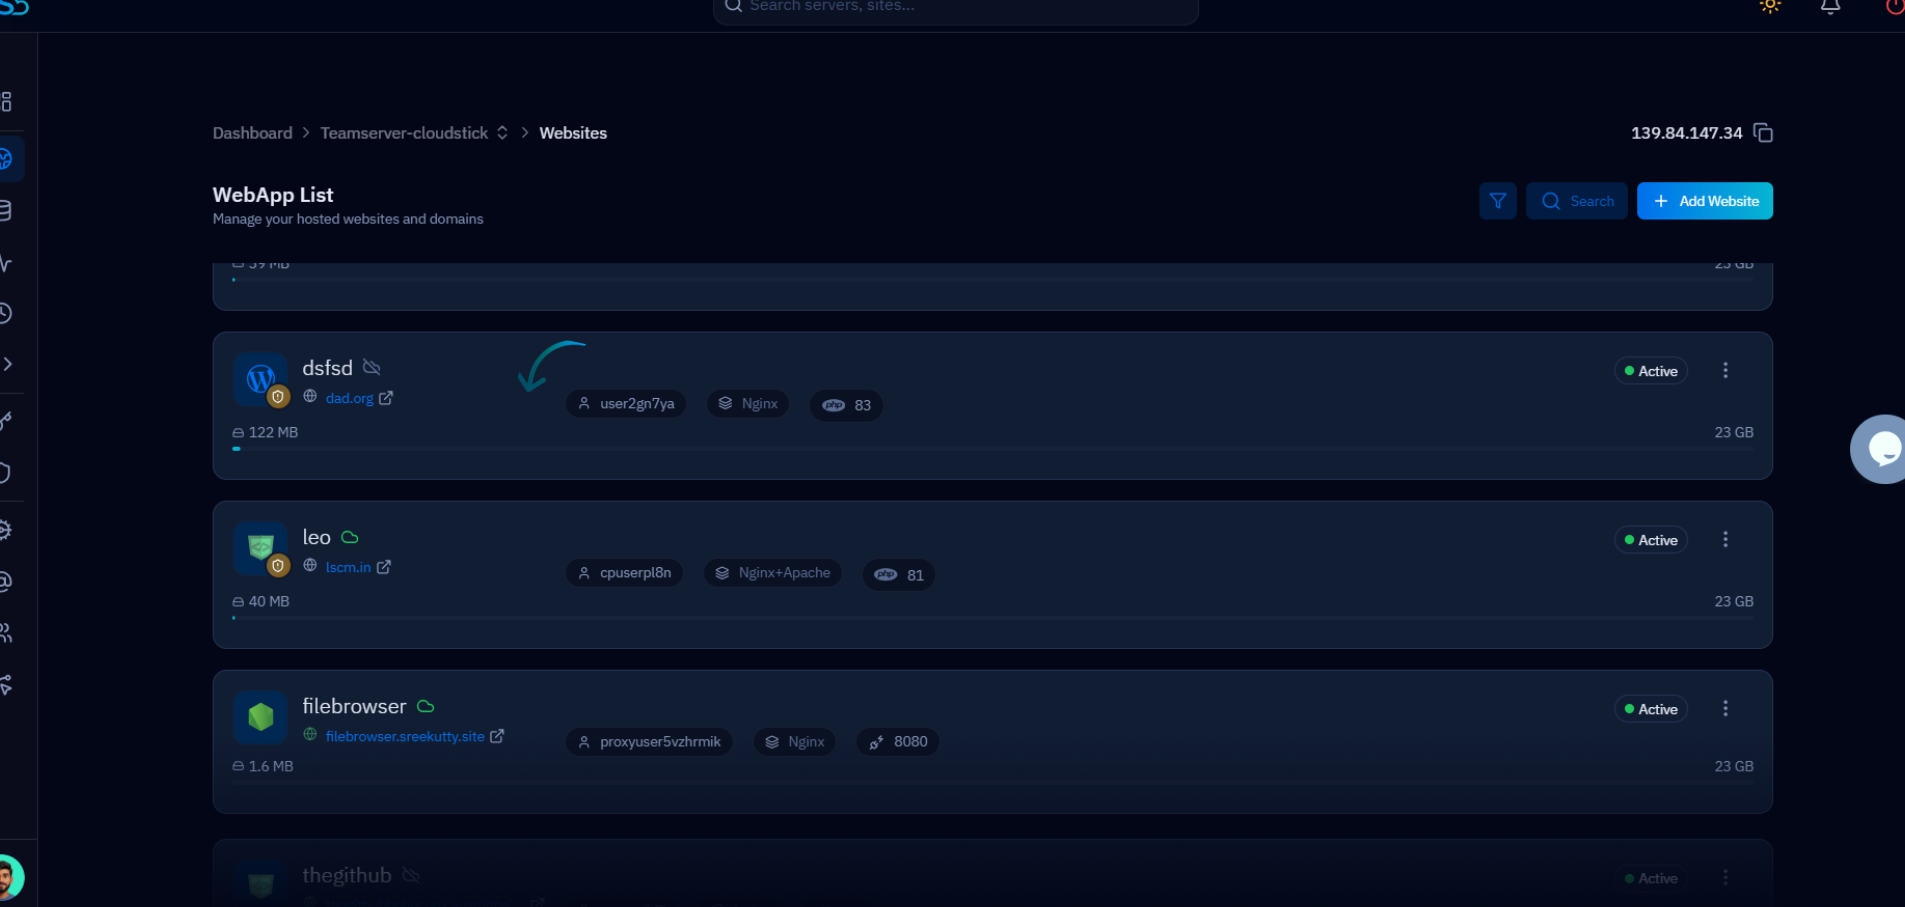
Fig. 01 — WebApp List showing all hosted websites and domains on the server.
3. Select your web application: Click on the name of the site you want to monitor. This opens its individual management panel.
4. Click on the Activity Logs tab: Inside the web application panel, locate and click the Activity Logs tab in the top navigation.
Once you click Activity Logs, CloudStick will display all recent activities and events for that specific web application, organized by date.
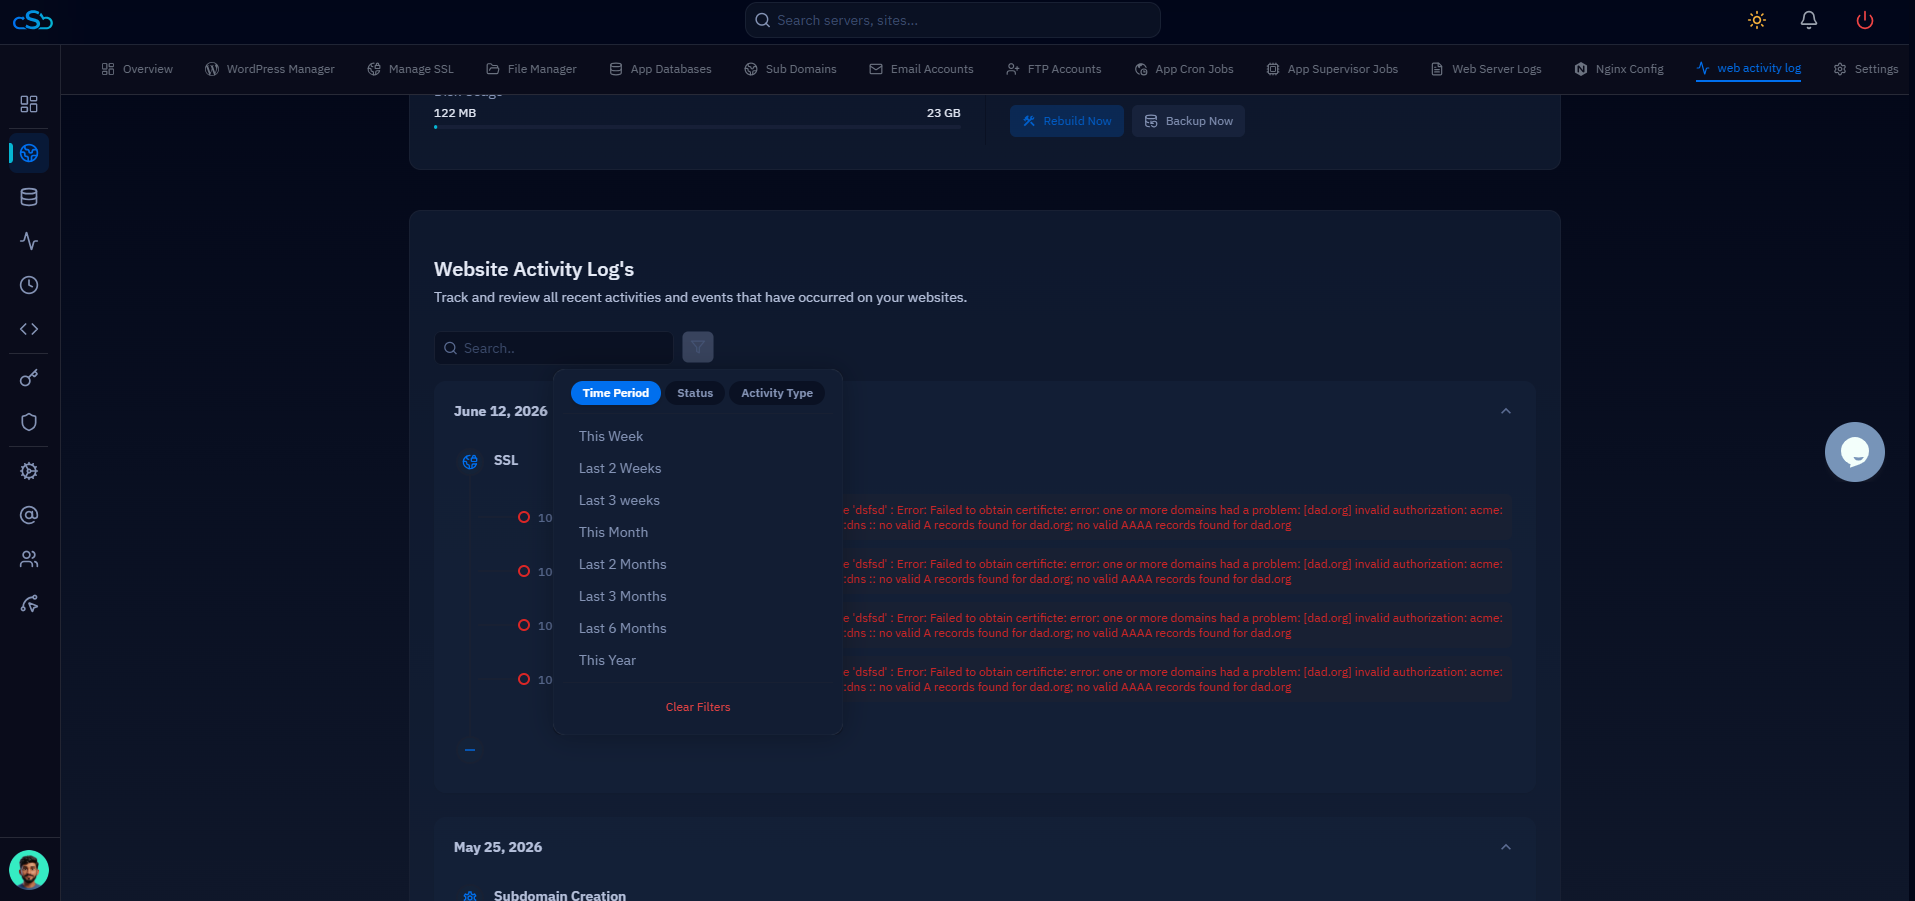
Fig. 02 — Website Activity Log's page showing recent events grouped by date with status indicators.
Step 2: Use Filters to Refine Your Logs
When a site has many events, the filter toolbar lets you narrow the log view to only the entries you care about. Three independent filters are available and can be combined.
Available Filters
Time Period filter: Select a predefined date range — such as last 24 hours, last 7 days — or choose a custom range to target a specific window in time. This is useful when investigating an incident that happened at a known date.
Status filter: Filter log entries by their outcome. Options include success, error, and failed. Use this to quickly surface only the problematic events without scrolling through successful ones.
Activity Type filter: Narrow results to a specific class of action — for example, deployments, updates, or configuration changes. Combine this with the Status filter (e.g., failed deployments) for precise incident investigation.
Applying the Filters
Select your desired values in one or more of the filter dropdowns at the top of the Activity Logs page.
Click Apply (or the equivalent confirm action) to update the log view with your selected criteria.
The log list will refresh to show only the events that match all active filters simultaneously.
To reset, clear the filter selections and apply again — the full log history will return.
Filters are applied in combination. For example, selecting Status: "error" and Activity Type: "deployments" shows only failed deployment events — not all errors and not all deployments.