How to Enable Debugging Mode in WordPress
Overview
When a WordPress site misbehaves — a white screen, a plugin conflict, a theme error — the fastest way to find the cause is WordPress debug mode. Debugging logs PHP errors, notices, and warnings as they happen, giving you the exact information you need to troubleshoot. Normally you would enable it by editing WP_DEBUG in wp-config.php by hand.
The CloudStick WordPress Manager makes this a single toggle: the Debugging option in the General settings section turns WordPress debug mode on or off instantly — no file editing and no WordPress admin login required. This guide shows you exactly where to find it.
This guide applies to WordPress websites hosted on a CloudStick-managed server. If you haven't set up your site yet, see How to install WordPress in CloudStick first. Debug mode is a troubleshooting tool — turn it off again on a live production site once you've finished, so error details aren't exposed and log files don't grow unnecessarily.
Step 1: Log In to CloudStick
Everything starts from the CloudStick dashboard, which lists all the servers connected to your account.
Sign in to CloudStick: Log in to your CloudStick account with your credentials to open the main dashboard.
Step 2: Open Your Server
Each server card on the dashboard shows live stats such as CPU, RAM, and disk usage. Open the server that hosts the WordPress website you want to debug.
Go to Servers: From the dashboard, locate the server card for the machine hosting your WordPress site.
Select your server: Click the server name (or its Manage link) to open the server panel.
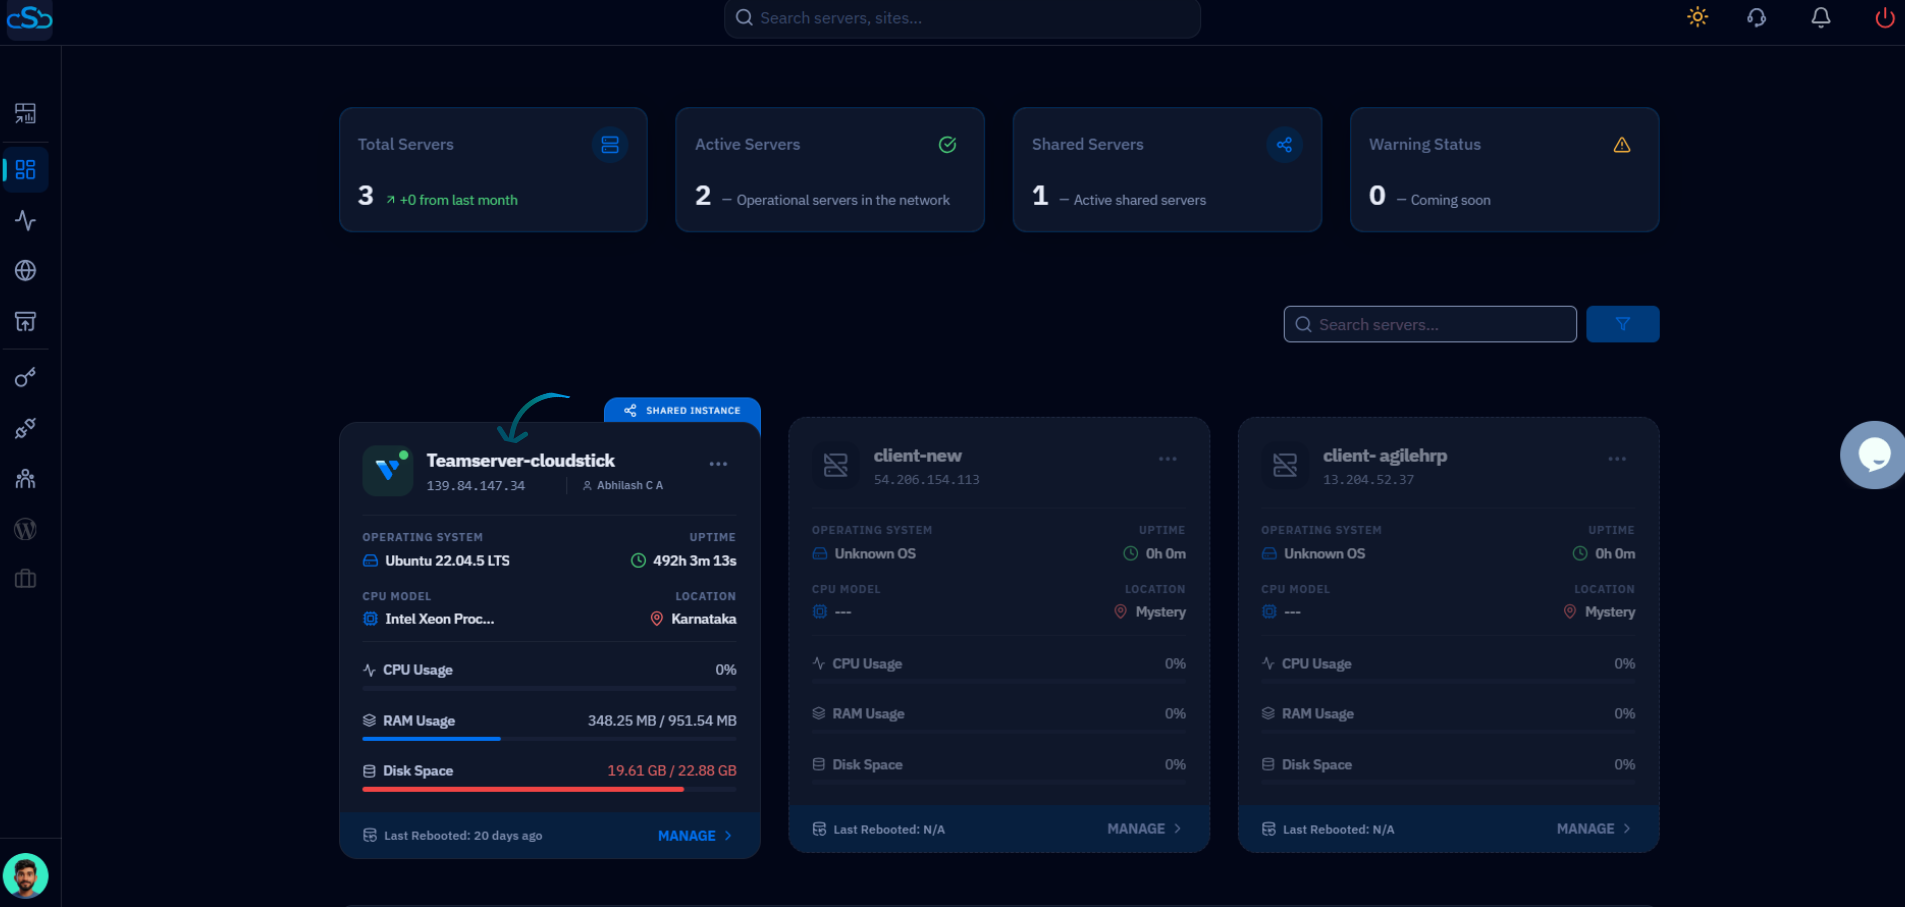
Fig. 01 — The CloudStick dashboard showing connected servers; select the server that hosts your WordPress website.
Step 3: Select Your WordPress Website
Inside the server panel, the WebApp List shows every website hosted on the server. WordPress sites are easy to spot by the WordPress logo on their card.
Open the Websites section: From the left-hand navigation, go to Websites to view the WebApp List.
Click your WordPress website: Select the site you want to enable debugging for.
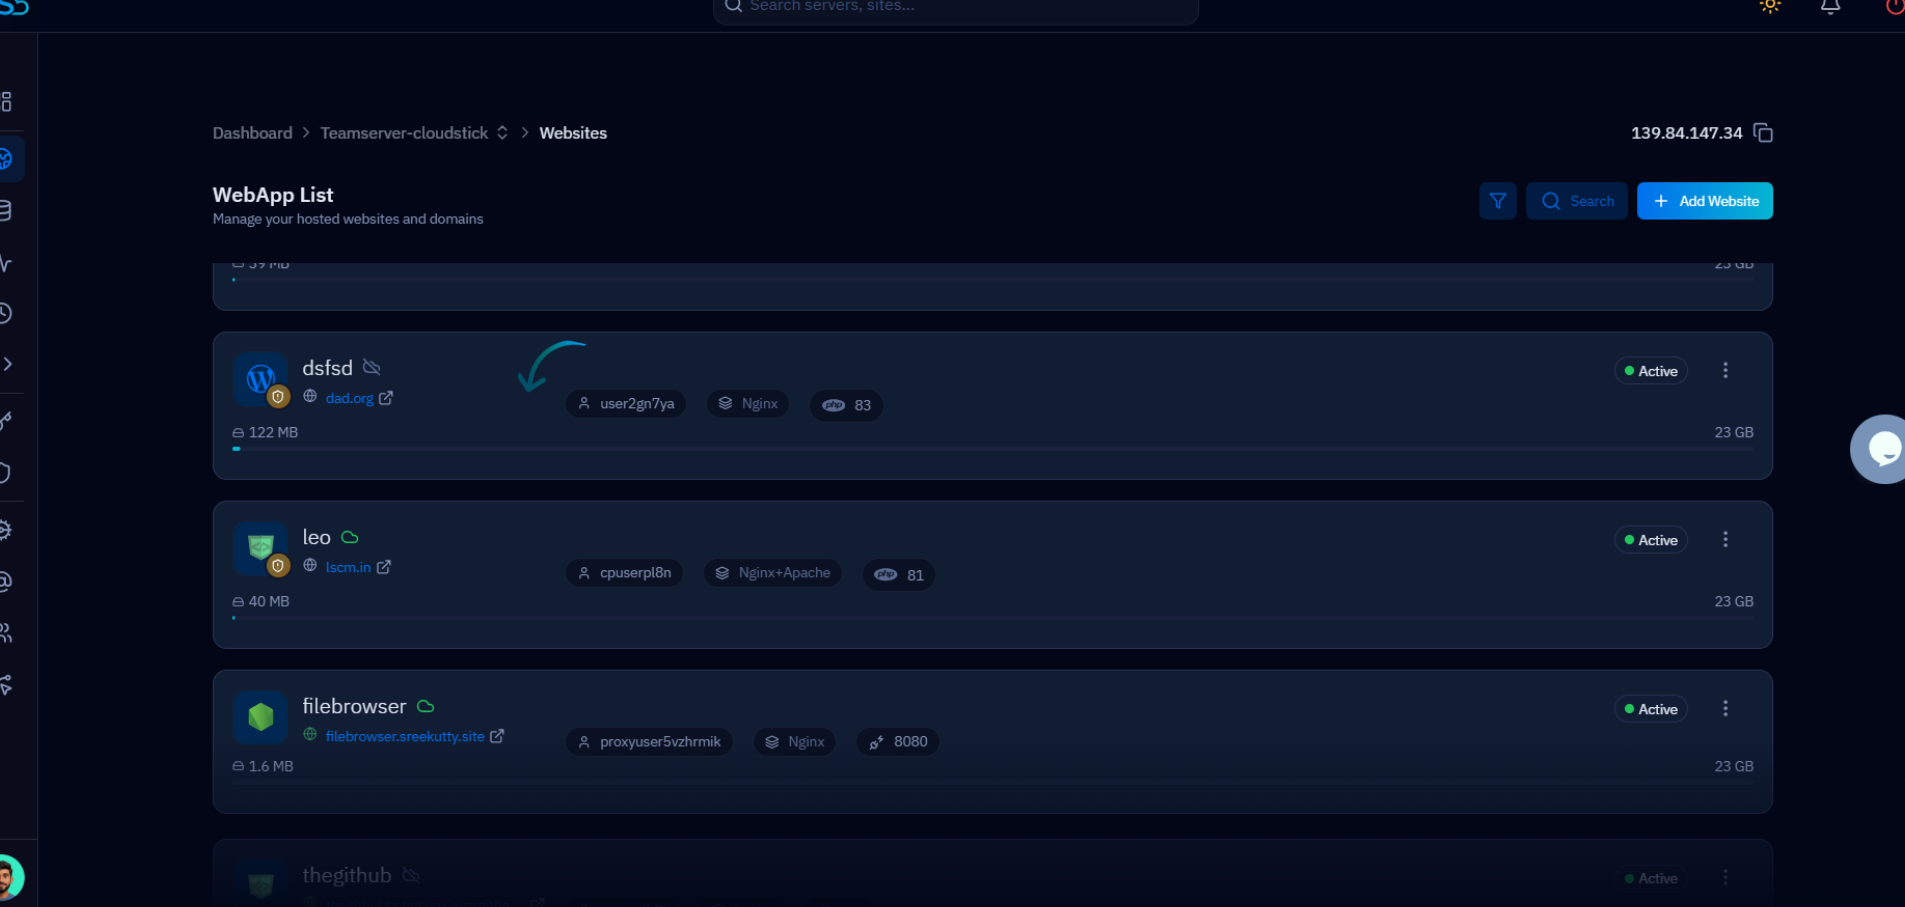
Fig. 02 — The WebApp List showing hosted websites; click the WordPress website you want to debug.
Step 4: Open the WordPress Manager
The website view opens on the Website Summary, showing your domain, PHP version, and disk usage. The WordPress-specific controls live in the WordPress Manager.
Click the WordPress Manager tab: Select WordPress Manager from the tab bar at the top of the website view to open the management panel for your WordPress installation.
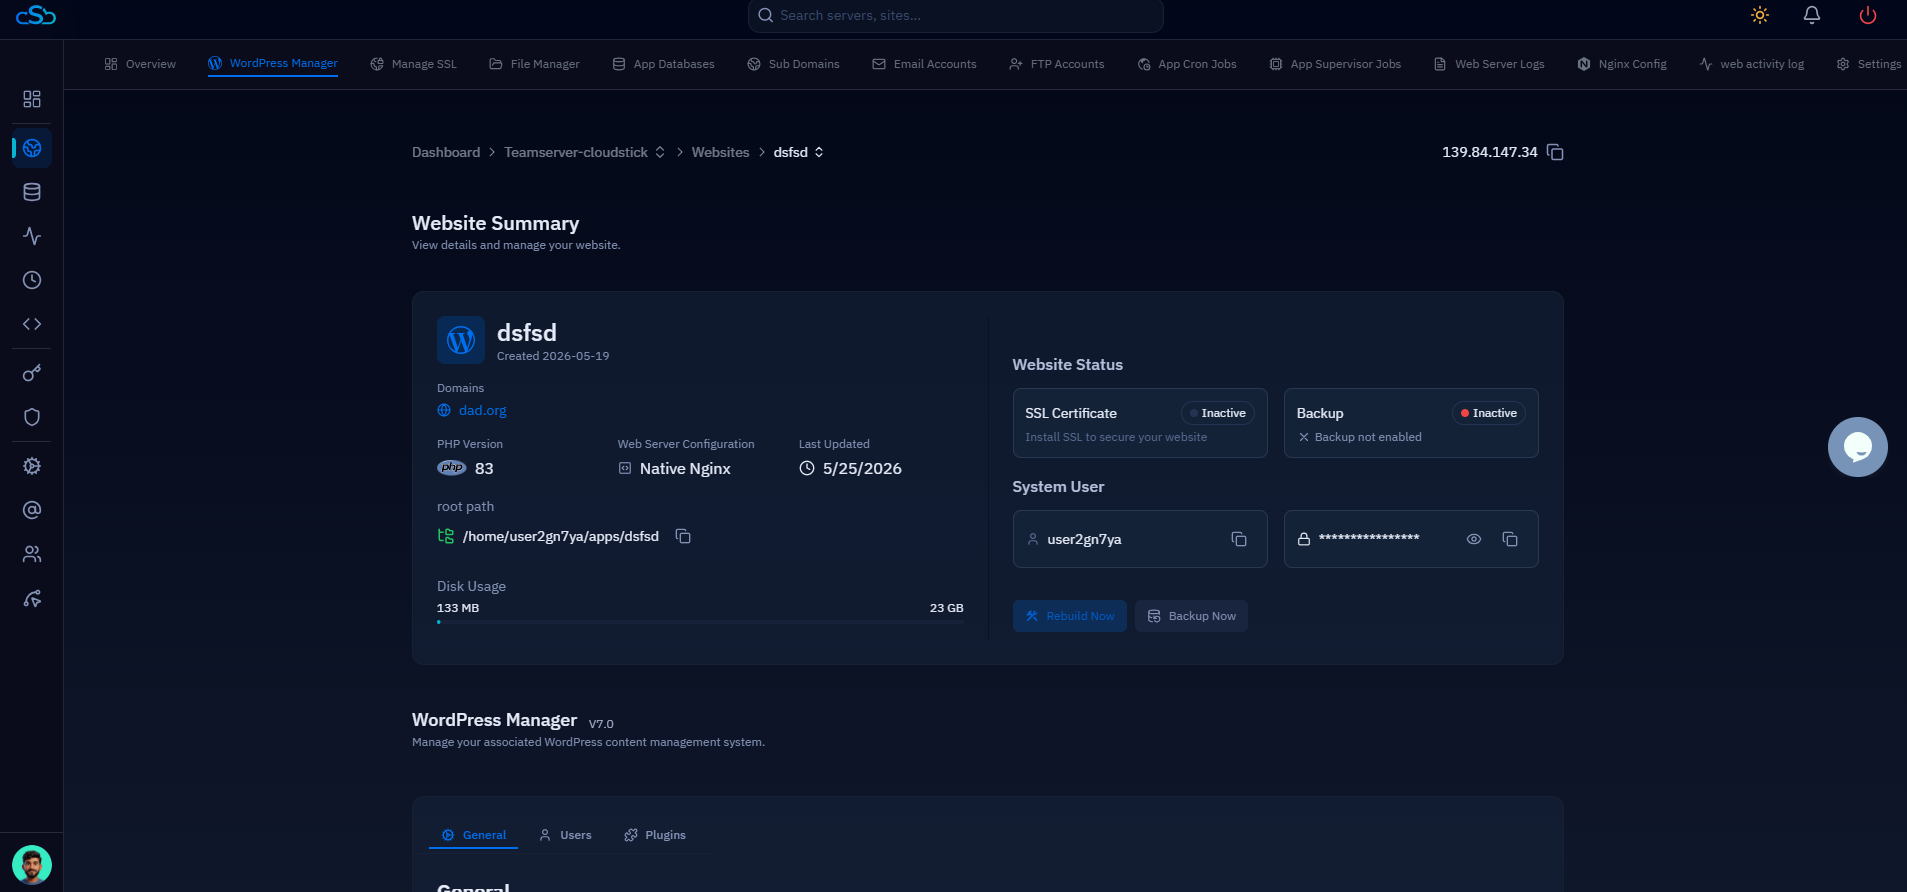
Fig. 03 — The Website Summary with the WordPress Manager tab selected, showing the WordPress management panel.
Step 5: Go to General Settings
The WordPress Manager is organized into General, Users, and Plugins tabs. Site-wide options, including the debugging control, live under General.
Open the General section: Click the General tab and scroll down to the Visibility & Tools area, which controls how your site is seen and managed.
Step 6: Enable Debugging
Under Visibility & Tools you'll find the Debugging option, described as "Enable WordPress debugging to log errors." It sits alongside the Maintenance Mode and Search Engine Visibility toggles.
Turn on the Debugging toggle: This enables WordPress debug mode for your site immediately.
Reproduce the issue: Visit the page or action that was failing — errors, notices, and warnings are now logged for troubleshooting.
When you're done: Return to this toggle and turn debugging off, especially on a live production site.
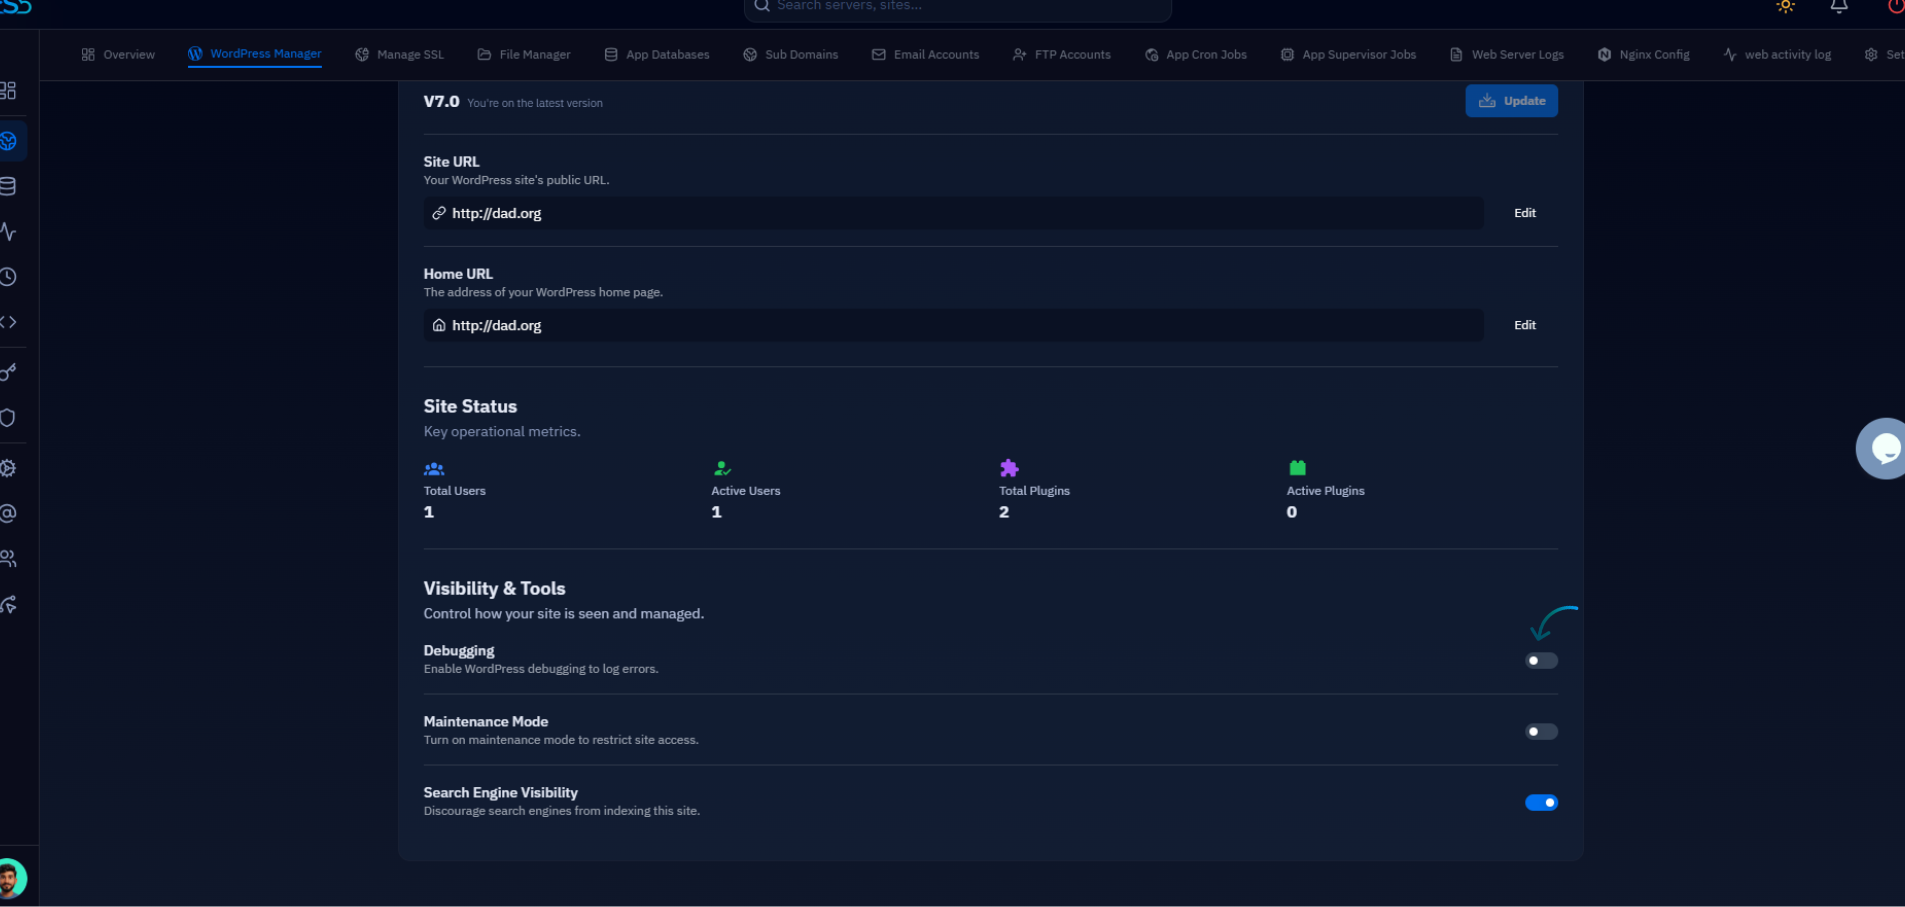
Fig. 04 — The Visibility & Tools area in General settings with the Debugging toggle highlighted.
Debugging mode is now enabled, and WordPress errors will be logged for troubleshooting. You can review the logged errors alongside your server logs — see How to access web server logs — to pinpoint misbehaving plugins, themes, or custom code.